R语言中绘图可以选取自带的基础绘图系统plot(),也可以选择ggplot2包。前者像“命令式”作画,一步步下达指令,在画布上添加元素;后者像“声明式”设计,基于“图形语法”,用“图层”叠加的方式构建图形。
基础内容
绘图模板如下:
1
2
3
4
5
6
7
8
|
ggplot(data = 数据集, mapping = aes(映射规则)) +
  geom_xxx(图层参数, stat = 统计变换, position = 位置调整) + # 几何图层
  scale_xxx(标度参数) + # 坐标轴/颜色/形状标度
  coord_xxx() + # 坐标系
  facet_xxx() + # 分面
  labs() + # 标题、坐标轴标签
  guides() + # 图例精细调整
  theme() # 全局美化主题
|
geom_point()
散点图 |
geom_smooth()
拟合曲线(线性 /loess 平滑,自带置信区间) |
geom_line()
折线图(x 轴数值从小到大排序) |
geom_path()
连线(从上到下的原始行顺序) |
geom_boxplot()
箱线图(分组分布) |
geom_violin()
小提琴图 |
geom_jitter()
抖动散点(解决点重叠) |
geom_histogram()
直方图(连续变量分布) |
geom_density()
密度曲线 |
geom_col()
柱状图(y数值作为柱子高度) |
geom_bar()
计数柱状图(统计 x 频数) |
geom_text()/geom_label()
文字标签 |
geom_errorbar()
误差棒 |
geom_hline()/geom_vline()
水平 / 垂直参考线 |
geom_ribbon()
画两条 y 曲线之间填充的带状区域 |
geom_rug()
边缘地毯图(一种一维散点图) |
- stat 统计变换:geom 底层自带统计计算,可手动修改
stat参数
stat="count" |
计数(geom_bar 默认) |
stat="identity" |
直接使用原始 y 值(geom_col 默认) |
stat="smooth" |
拟合平滑曲线(geom_smooth) |
stat="bin" |
分箱统计(直方图) |
position = "identity" |
默认,不偏移 |
position = "dodge" |
分组并列柱状图 |
position = "stack" |
堆叠柱状图 |
position = "fill" |
百分比堆叠柱状 |
position = "jitter" |
点抖动防重叠 |
- scale标度:负责数据→视觉属性转换,同时生成坐标轴刻度、图例,命名规则为
scale_视觉属性_类型
scale_x_continuous()/scale_y_continuous() |
连续轴(对数trans="log10"、调整范围 limits) |
scale_x_discrete() |
分类 x 轴(修改标签、调整顺序) |
scale_color_manual()/scale_fill_manual() |
手动自定义颜色向量 |
scale_color_brewer() |
RColorBrewer 配色 |
scale_color_viridis_c() |
连续渐变配色 |
scale_size()、scale_shape_manual() |
大小 / 形状标度 |
coord_cartesian() |
默认直角坐标 |
coord_flip() |
xy 轴翻转,横向柱状图 |
coord_polar() |
极坐标(饼图、雷达图) |
coord_log10() |
对数坐标轴 |
coord_fixed() |
固定 xy 轴比例(等比例散点图) |
- Facet 分面(多子图):按分类变量自动拆分图表,无需循环绘图
facet_wrap(~变量) |
一维分面,自动换行 |
facet_grid(行变量 ~ 列变量) |
二维网格分面 |
1)内置完整主题:
theme_bw() |
白底 + 浅灰色网格线,带黑色边框 |
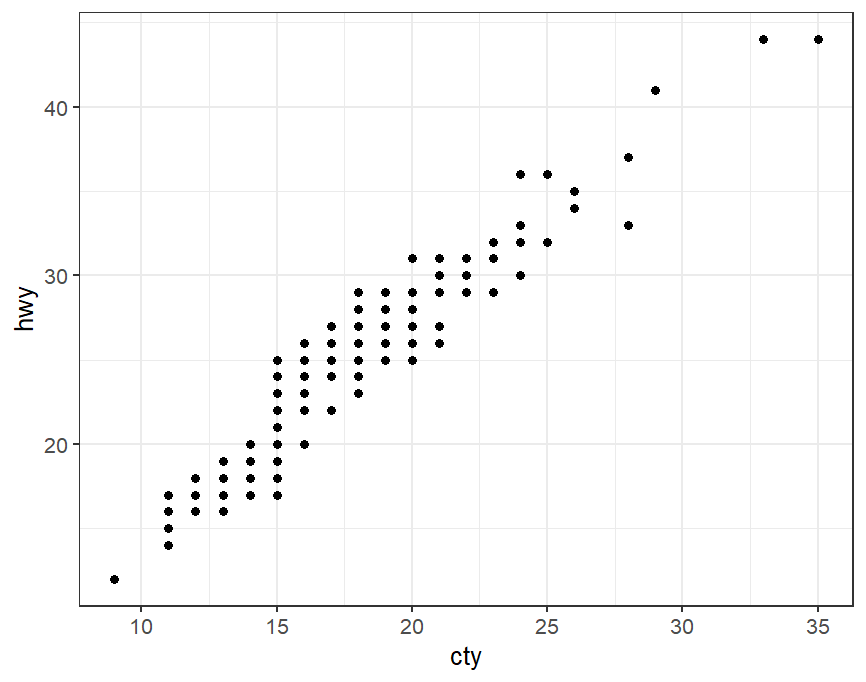 |
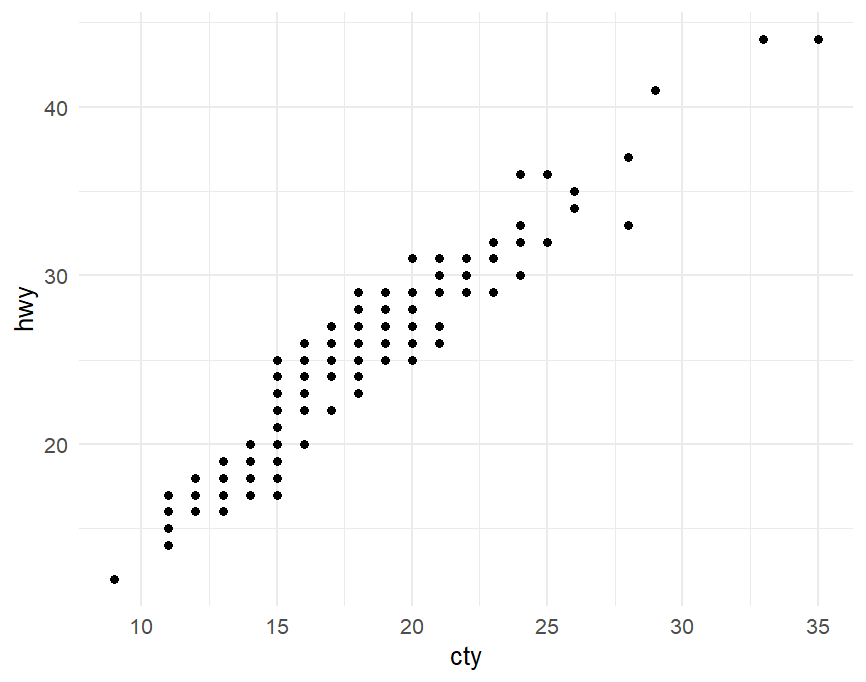
theme_minimal() |
无边框、浅细网格 |
 |
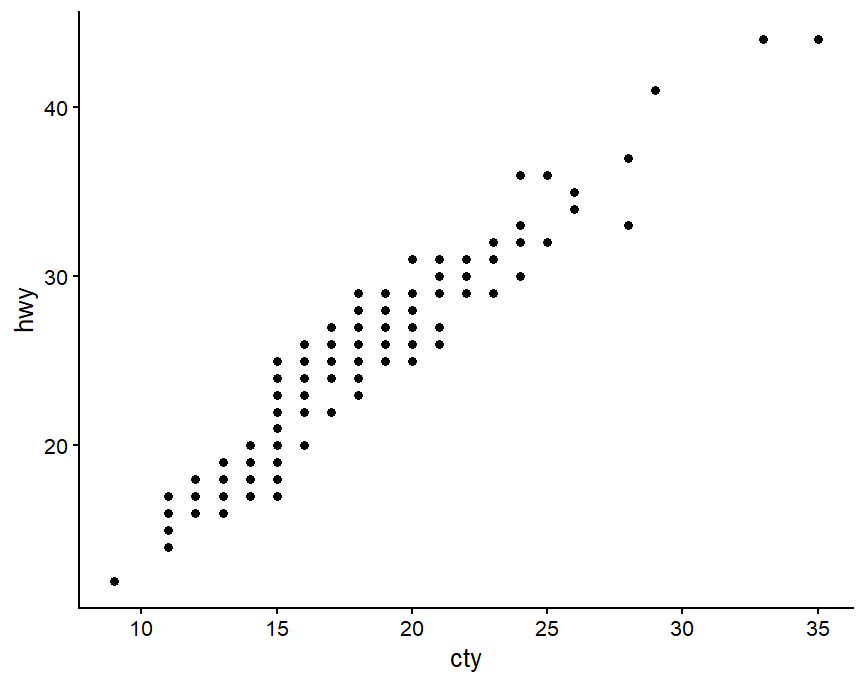
theme_classic() |
无网格,仅保留 XY 黑色轴线 |
 |
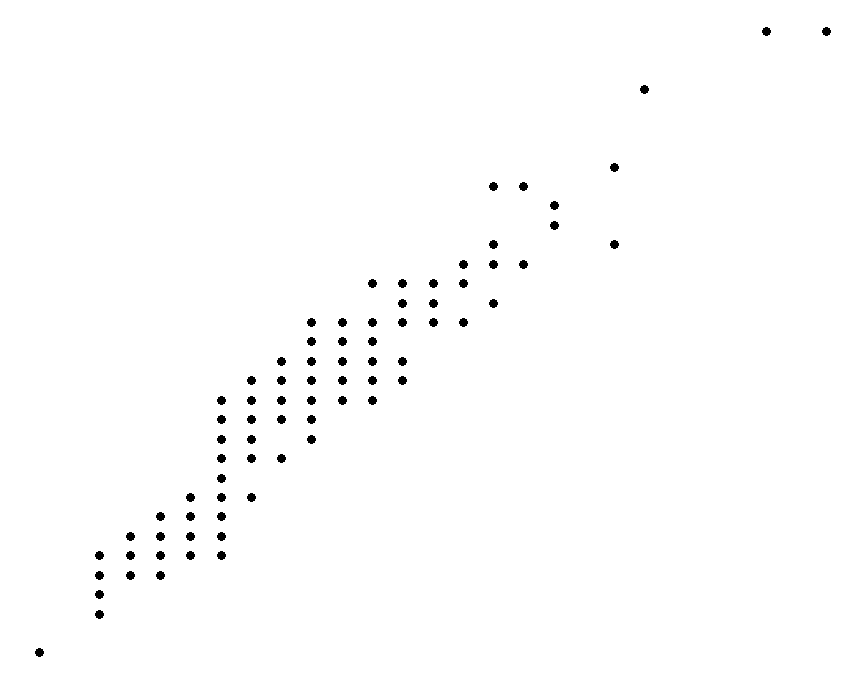
theme_void() |
完全空白,无坐标轴、无背景 |
 |
2)labs ():
 1
 2
 3
 4
 5
 6
 7
 8
 9
10
|
labs(
  title = "主标题",
  subtitle = "副标题",
  caption = "图注",
  x = "X轴名称",
  y = "Y轴名称",
  color = "颜色图例标题",
  size = "大小图例标题",
  fill = "填充图例标题"
)
|
3)guides():精细化控制图例
1
2
3
4
5
6
7
|
guides(
  映射名1 = guide_legend(参数...), # 用于普通离散 / 连续图例
  映射名2 = guide_colorbar(参数...) # 用于连续渐变色条图例
)
# override.aes:强制修改图例里图标的样式
# 图例里的圆点统一放大到size=5,不改变原图散点尺寸
# guides(color = guide_legend(override.aes = list(size = 5, alpha = 1)))
|
4)theme():控制坐标轴文字、标题、网格、图例位置、边框、留白、背景等
标题相关——plot.title; plot.subtitle; plot.caption; strip.text(分面 facet_wrap 的子图标题);
坐标轴相关——axis.title.x / axis.title.y; axis.text.x / axis.text.y; axis.line
各种绘图
散点图
1
2
3
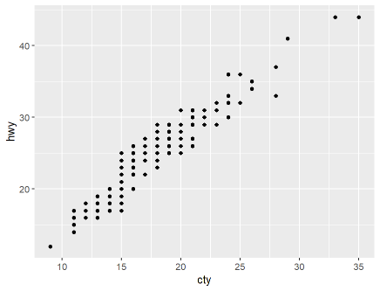
|
p<-ggplot(mpg,aes(x=cty,y=hwy))+
geom_point()
p
|
1
2
3
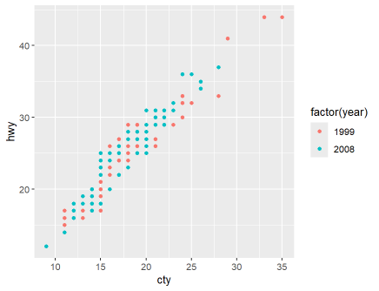
|
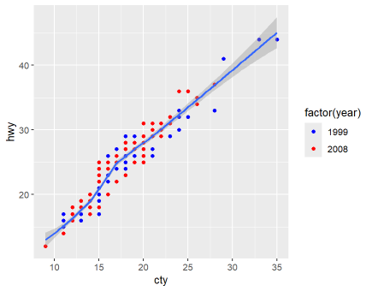
p<-ggplot(mpg,aes(x=cty,y=hwy,colour=factor(year)))+
geom_point()
p
|
1
2
3
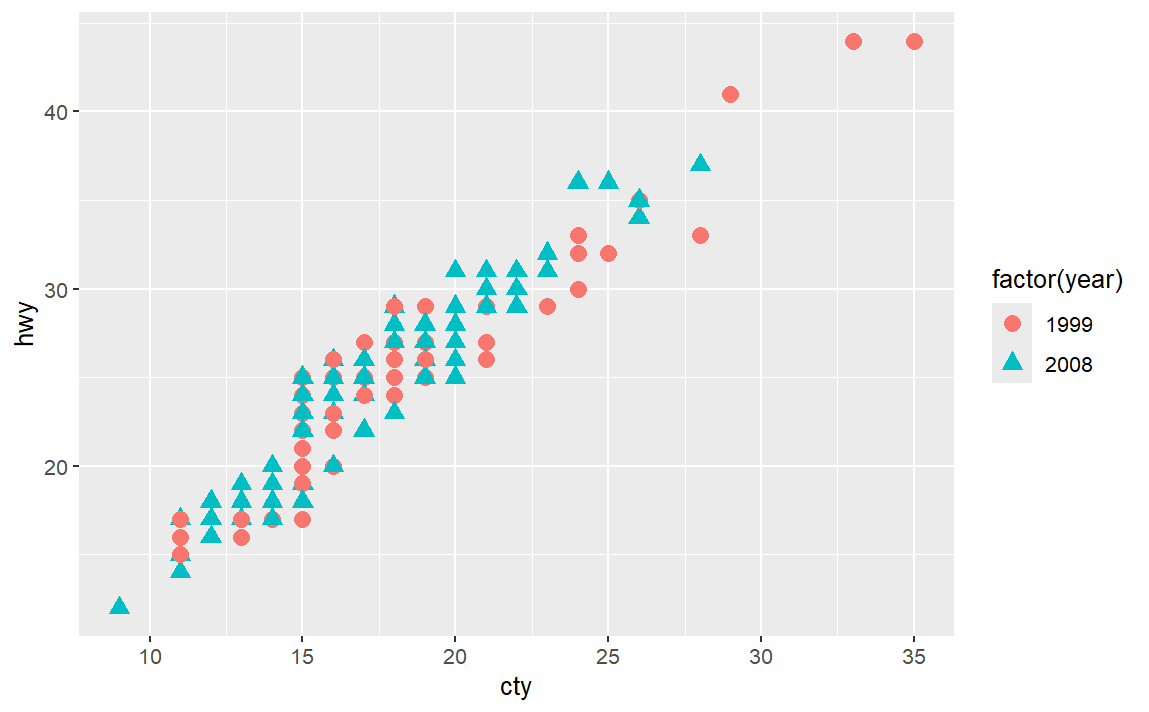
|
p<-ggplot(mpg,aes(x=cty,y=hwy,colour=factor(year),shape=factor(year)))+
geom_point(size=3)
p
|
 1
 2
 3
 4
 5
 6
 7
 8
 9
10
11
|
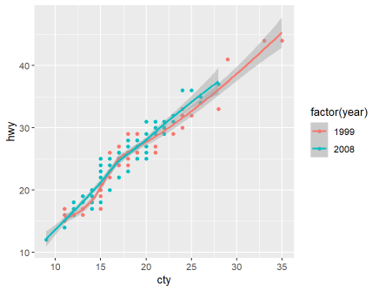
# 分开的散点按年份分两种颜色,分别拟合两条独立的拟合曲线
p<-ggplot(mpg,aes(x=cty,y=hwy,colour=factor(year)))+
geom_point()+
stat_smooth()
p

# 不分组地对全部数据拟合出一条统一的平滑曲线
p<-ggplot(mpg,aes(x=cty,y=hwy))+
geom_point(aes(colour=factor(year)))+
stat_smooth()
p
|
1
2
3
4
5
|
p<-ggplot(mpg,aes(x=cty,y=hwy))+
geom_point(aes(colour=factor(year)))+
stat_smooth()+
scale_color_manual(values =c('blue','red'))
p
|
 1
 2
 3
 4
 5
 6
 7
 8
 9
10
11
12
13
14
15
|
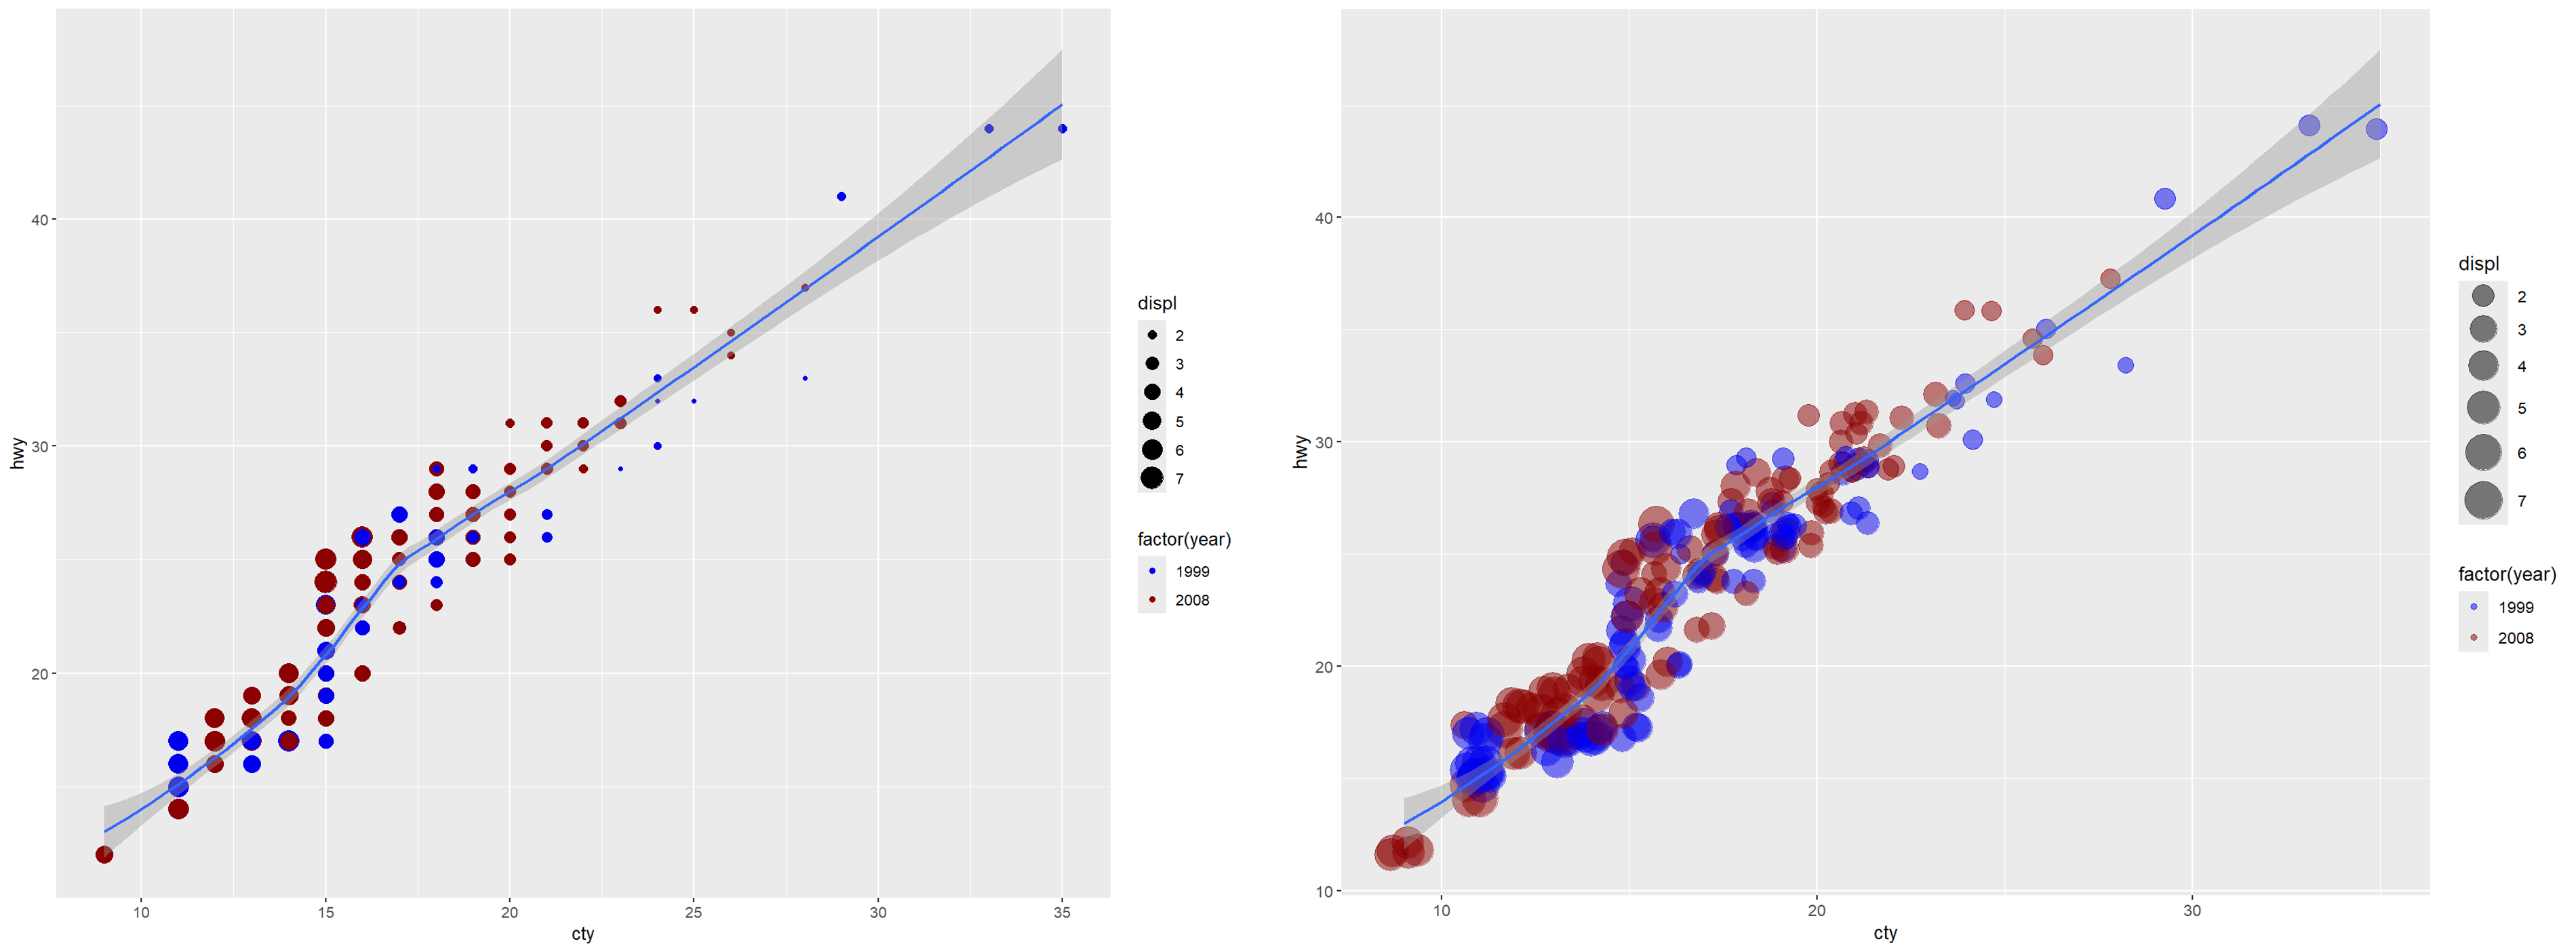
# 基础将displ数据作为点的大小标准
p<-ggplot(mpg,aes(x=cty,y=hwy))+
geom_point(aes(colour=factor(year),size=displ))+
stat_smooth()+
scale_color_manual(values=c('blue2','red4'))
p

# 调整点的大小范围、抖动和透明度;alpha=0.5调整透明度
p<-ggplot(mpg,aes(x=cty,y=hwy))+
geom_point(aes(colour=factor(year),size=displ),alpha=0.5,position="jitter")+
stat_smooth()+
scale_color_manual(values=c('blue2','red4'))+
scale_size_continuous(range=c(4,10))
#控制连续变量displ对应的点尺寸范围,最大为10,最小为4
p
|
1
2
3
4
5
6
7
8
|
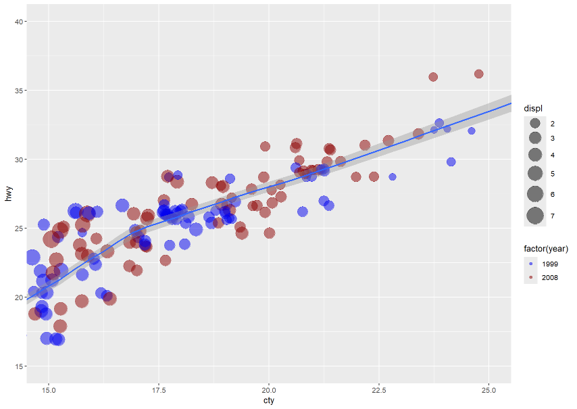
# 使用xlim和ylim限定坐标轴的范围
p<-ggplot(mpg,aes(x=cty,y=hwy))+
geom_point(aes(color=factor(year),size=displ),alpha=0.5,position="jitter")+
stat_smooth()+
scale_color_manual(values=c('blue2','red4'))+
scale_size_continuous(range=c(4,10))+
coord_cartesian(xlim=c(15,25),ylim=c(15,40))
p
|
 1
 2
 3
 4
 5
 6
 7
 8
 9
10
11
12
13
14
15
16
17
18
|
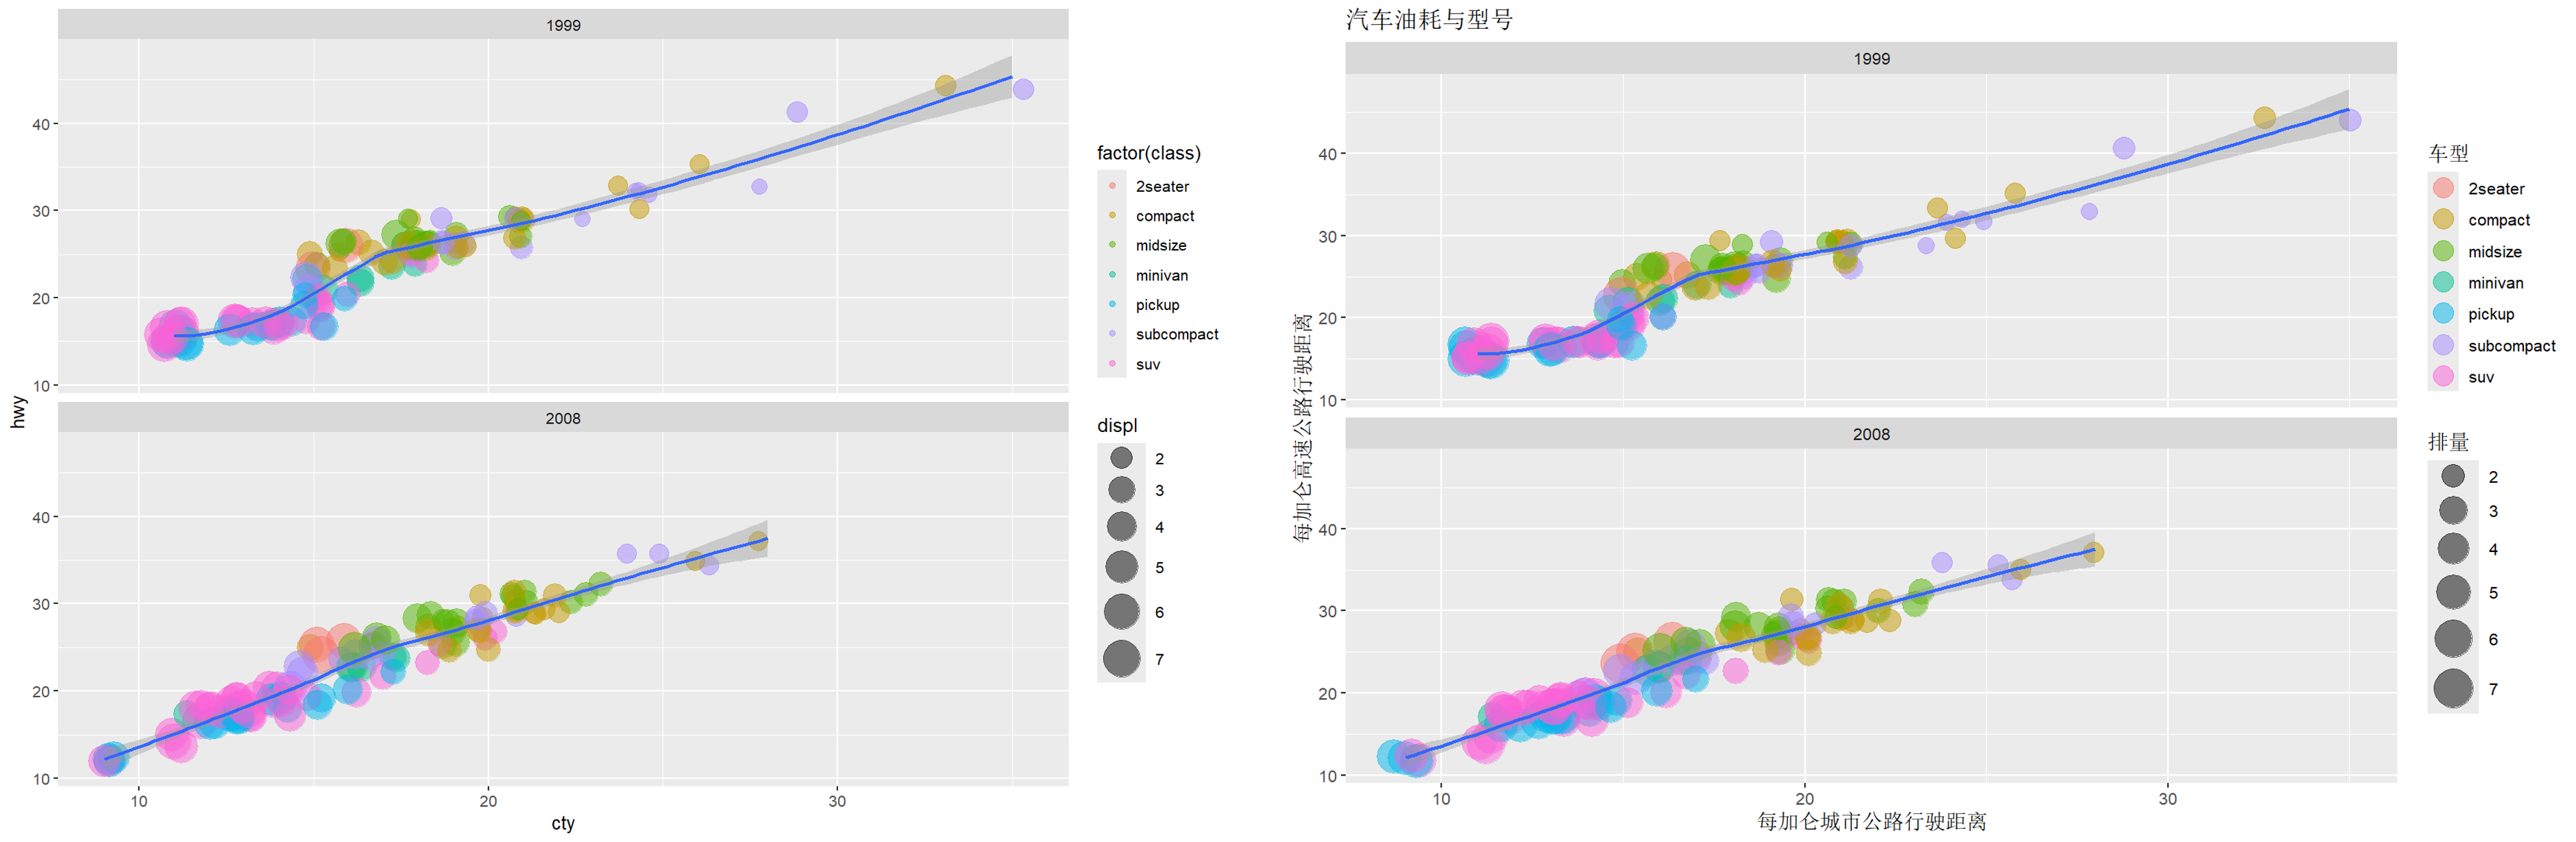
p<-ggplot(mpg,aes(x=cty,y=hwy))+
geom_point(aes(color=factor(class),size=displ),alpha=0.5,position="jitter")+
stat_smooth()+
scale_size_continuous(range=c(4,10))+
facet_wrap(~year,ncol=1) # ncol=1 上下排列两图
p

# 增添图名并精细修改图例
p<-ggplot(mpg,aes(x=cty,y=hwy))+
geom_point(aes(color=factor(class),size=displ),alpha=0.5,position="jitter")+
stat_smooth()+
scale_size_continuous(range=c(4,10))+
facet_wrap(~year,ncol=1)+
labs(title='汽车油耗与型号',y='每加仑高速公路行驶距离',x='每加仑城市公路行驶距离')+
guides(size=guide_legend(title='排量'),
    colour = guide_legend(title='车型',override.aes=list(size=5))
      )
p
|
直方图
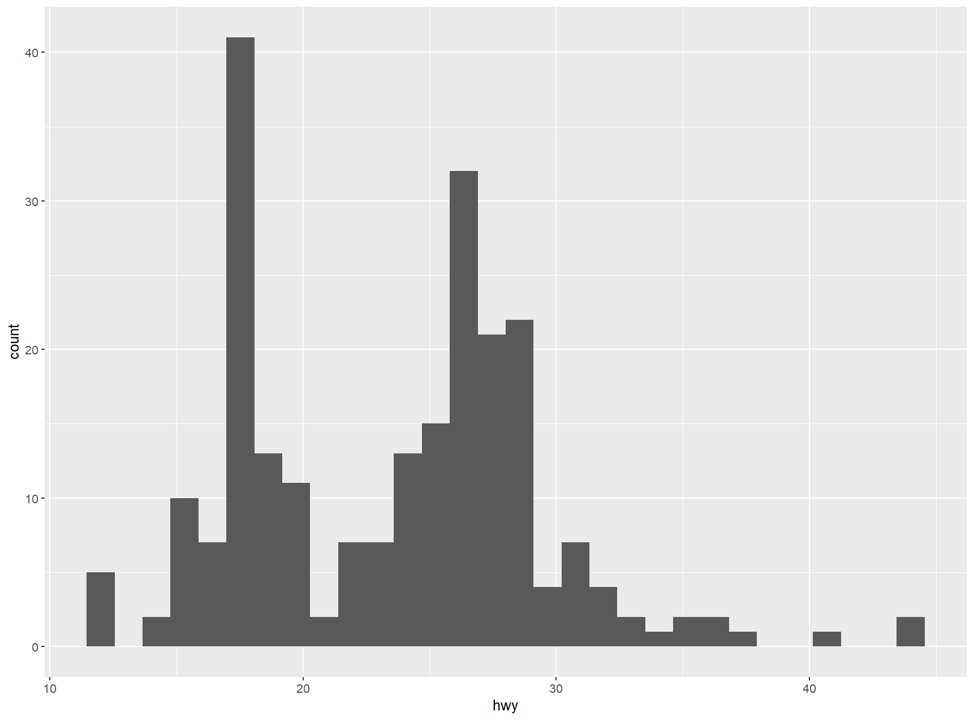
注意直方图的geom_histogram()是处理连续数值的分布,可以通过binwidth指定区间宽度;而geom_bar()是对每个数据的出现进行计数做出的柱状图。
1
2
3
|
p<-ggplot(mpg,aes(x=hwy))+
geom_histogram() # 这里由于数据mpg都是整数,geom_bar(binwidth=1)等价于geom_bar()
p
|
1
2
3
4
|
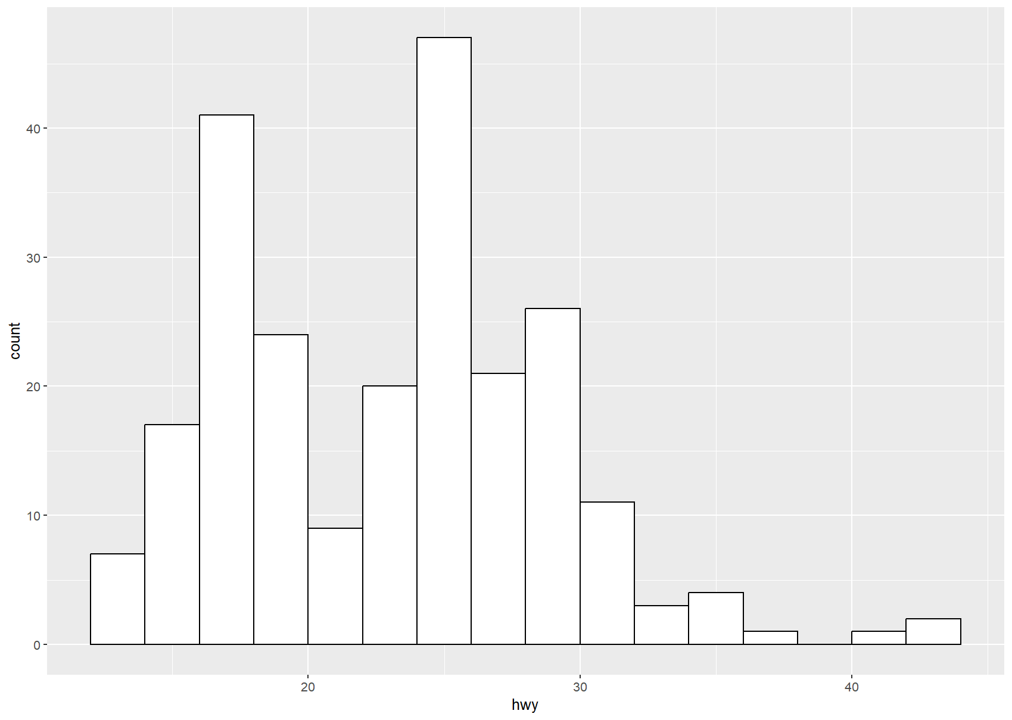
p<-ggplot(mpg,aes(x=hwy))+
geom_histogram(binwidth=2,fill='white',color='black',boundary = 30)
p
# boundary和binwidth共同确定直方图横轴的划分。比如boundary=20,binwidth=2,那么划分线为……16,18,20,22,24,……可见不同的划分线会影响直方图的样子。
|
 1
 2
 3
 4
 5
 6
 7
 8
 9
10
|
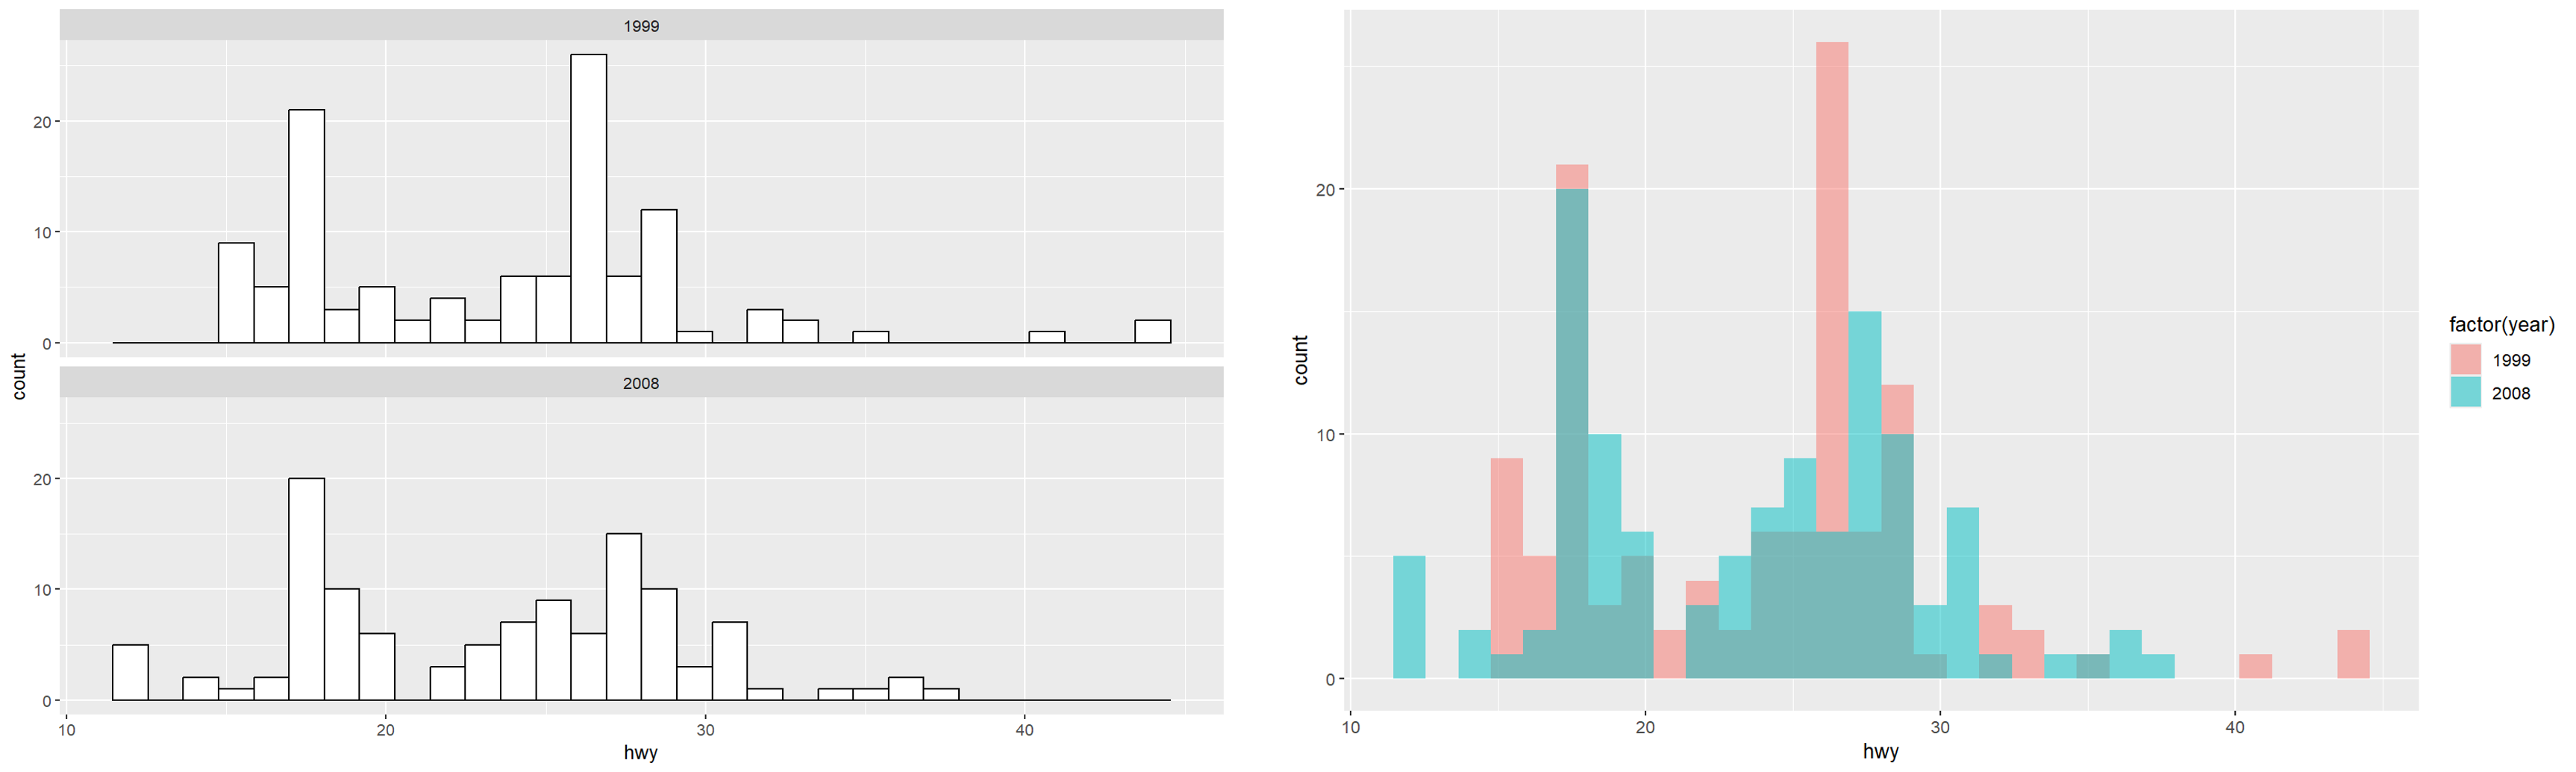
# 依据year分为2组
p<-ggplot(mpg,aes(x=hwy))+
geom_histogram(fill='white',color='black')+
facet_wrap(~year,ncol=1)
p

# 一张图中不同颜色表示分组
p<-ggplot(mpg,aes(x=hwy,fill=factor(year)))+
geom_histogram(position='identity',alpha=0.5)
p
|
 1
 2
 3
 4
 5
 6
 7
 8
 9
10
11
12
13
|
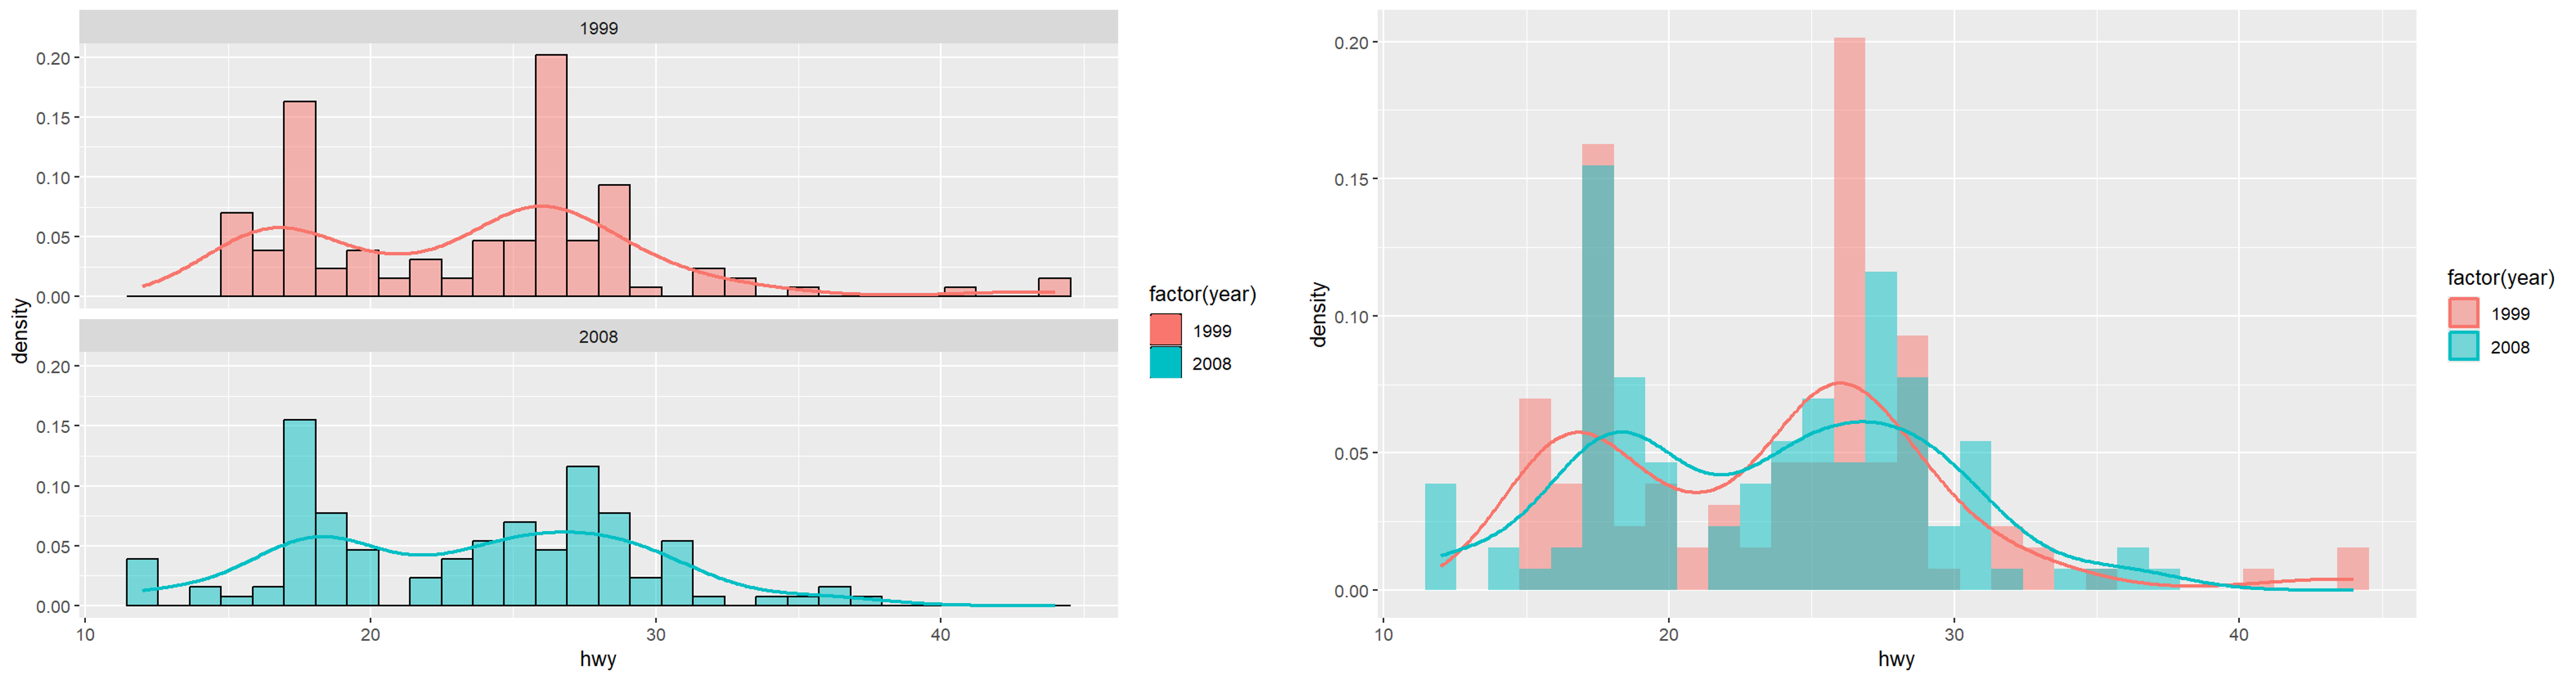
# 依据year分为2组
p<-ggplot(mpg,aes(x=hwy,y=..density..))+
geom_histogram(aes(fill=factor(year)),color='black',alpha=0.5)+
facet_wrap(~year,ncol=1)+
geom_density(aes(color=factor(year)),size=1,position='identity')
# +scale_fill_manual(values =c('blue','red')) #更改颜色可添加
p

# 一张图中不同颜色表示分组
p<-ggplot(mpg,aes(x=hwy,y=..density..,fill=factor(year)))+
geom_histogram(position='identity',alpha=0.5)+
geom_density(aes(color=factor(year)),size=1,position='identity',alpha=0)
p
|
柱状图
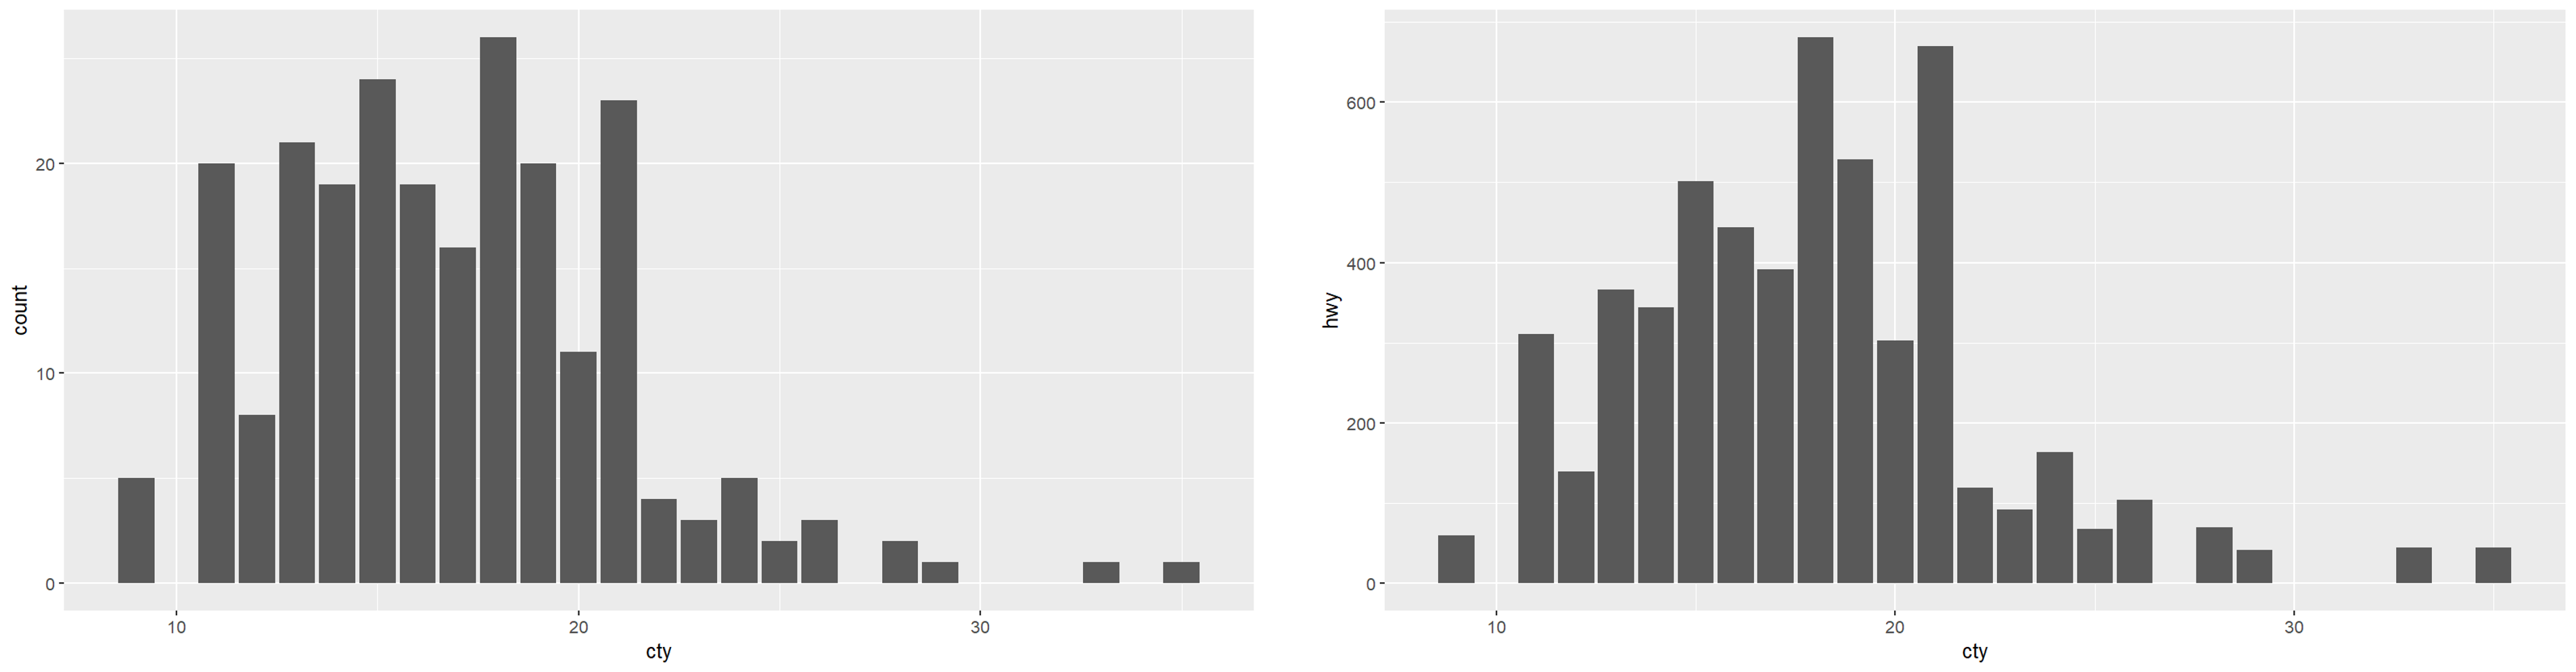
geom_bar()只有 X 分类,无现成 Y 数值,自动统计每组样本数量;而geom_col()X 是分类、Y 是你数据里已经存在的数值列,直接按给定高度画柱子。
1
2
3
4
5
6
7
8
9
|
# geom_bar()统计数量
p<-ggplot(mpg,aes(x=cty))+
geom_bar()
p

# geom_col()绘图
p<-ggplot(mpg,aes(x=cty,y=hwy))+
geom_col()
p
|
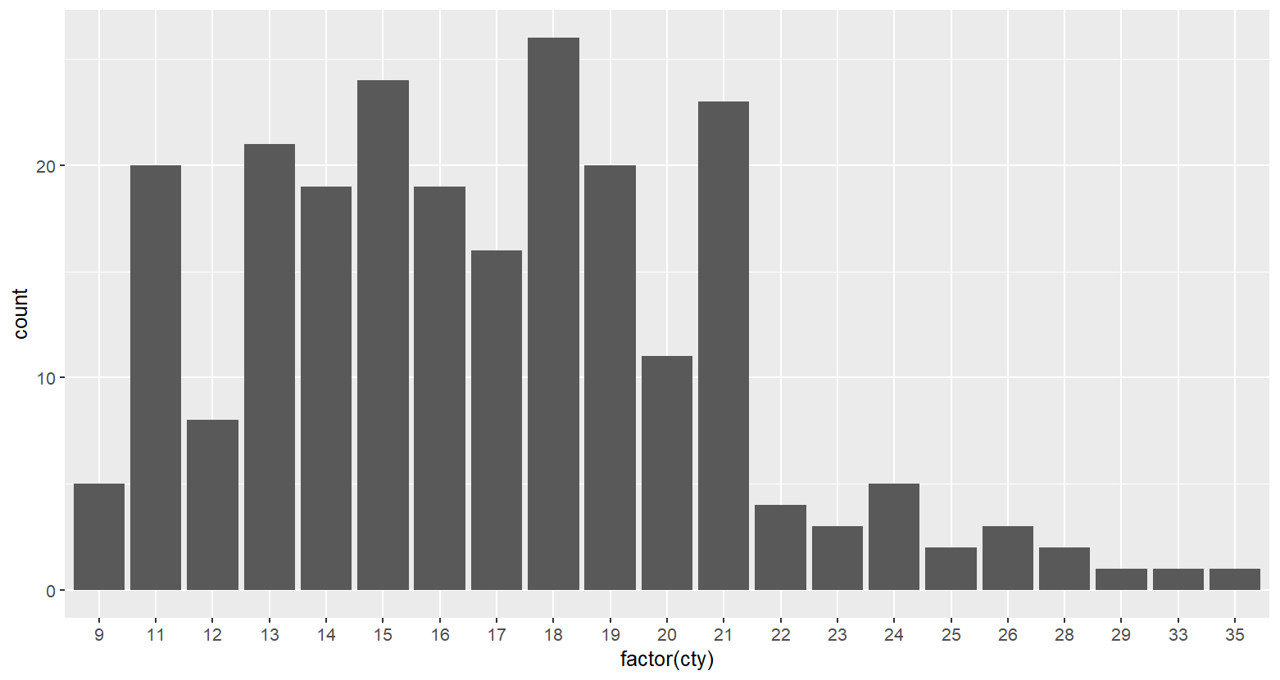
ps. 当对横轴转换成因子后,会把横轴变成连接在一起:
1
2
3
|
p<-ggplot(mpg,aes(x=factor(cty)))+
geom_bar()
p
|
1
2
3
4
5
6
7
8
9
|
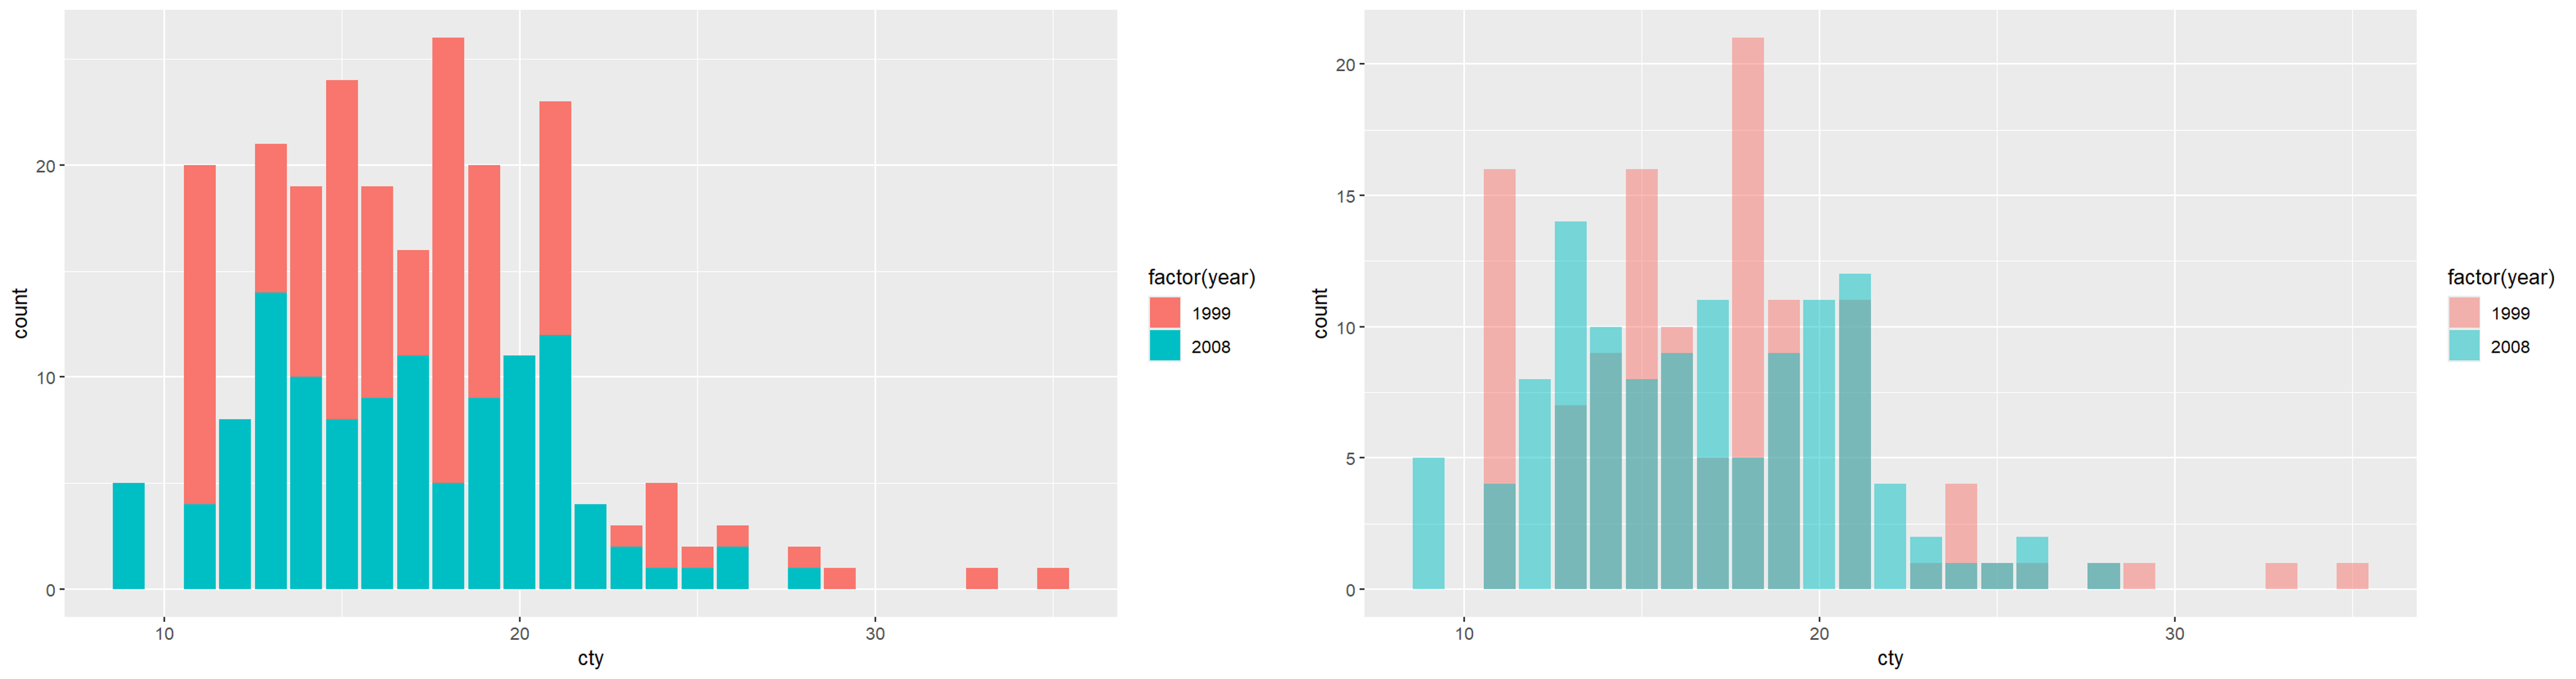
# 分开显示
p<-ggplot(mpg,aes(x=cty))+
geom_bar(aes(fill=factor(year)))
p

# 重叠显示
p<-ggplot(mpg,aes(x=cty))+
geom_bar(aes(fill=factor(year)),position='identity',alpha=0.5)
p
|
1
2
3
4
5
6
7
8
9
|
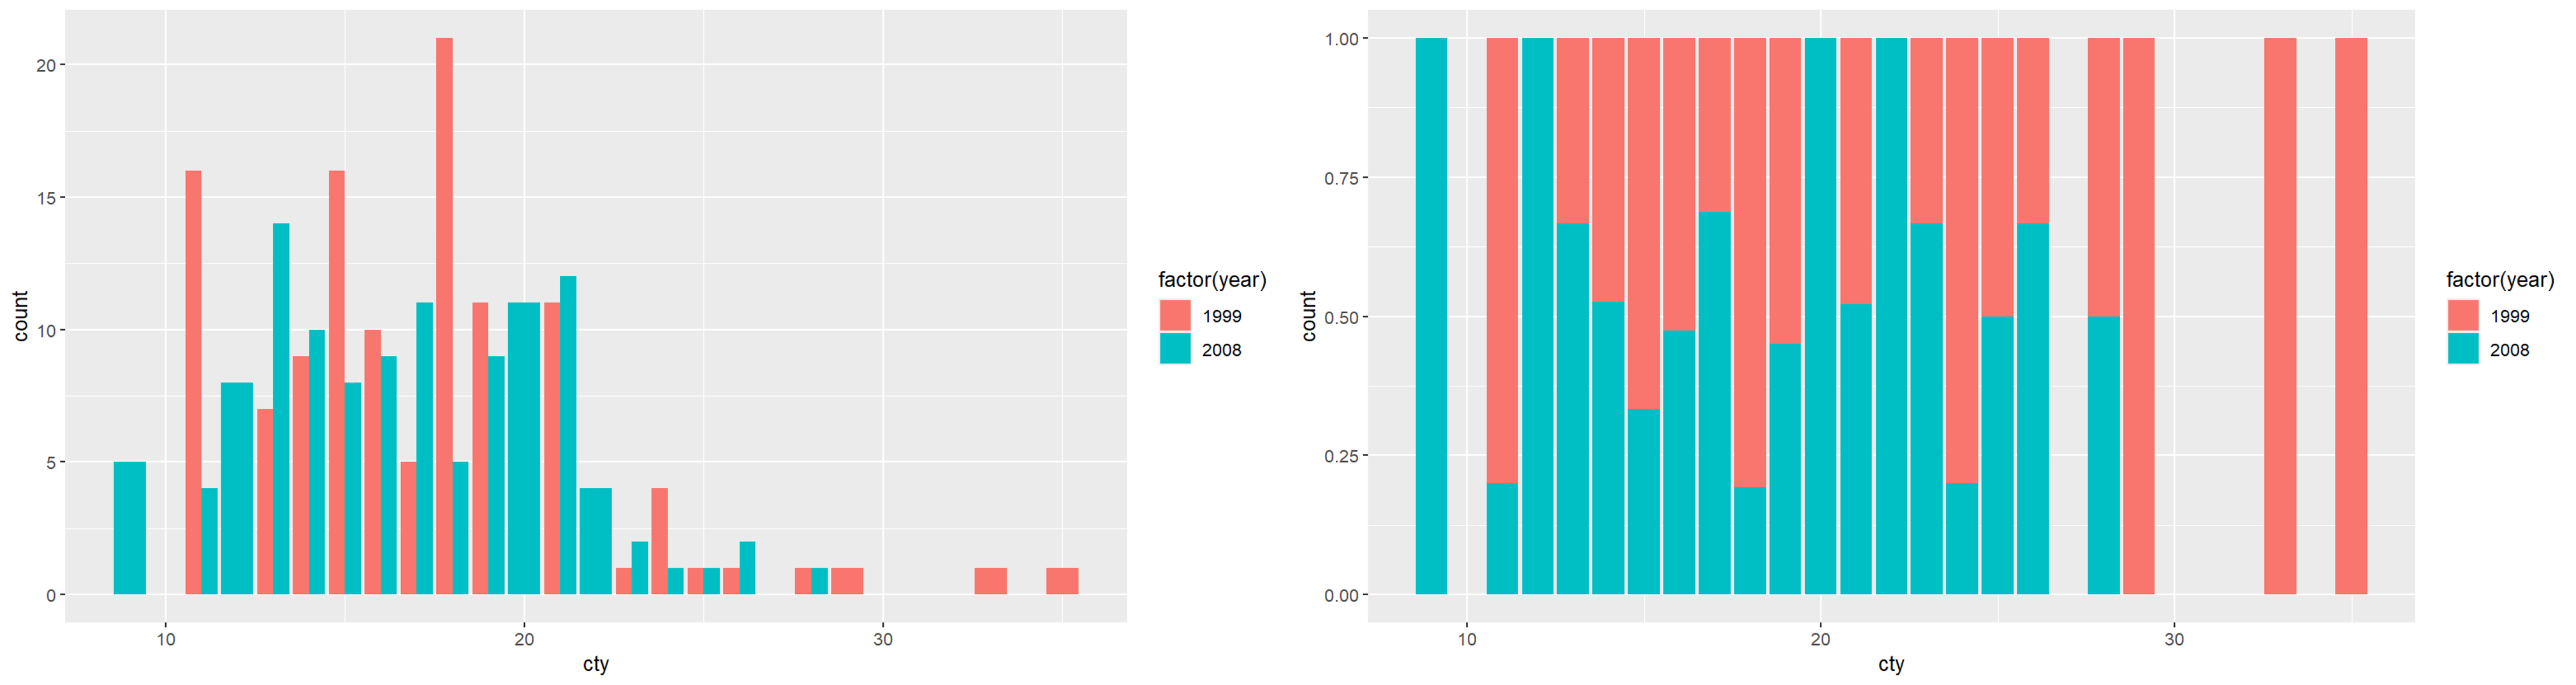
# 并立式
p<-ggplot(mpg,aes(x=cty))+
geom_bar(aes(fill=factor(year)),position='dodge')
p

# 相对比例式
p<-ggplot(mpg,aes(x=cty))+
geom_bar(aes(fill=factor(year)),position='fill')
p
|
用单个圆点代表每个分类的数值,默认横向排布、分类纵向排序,用来替代柱状图做多分类数值对比。
 1
 2
 3
 4
 5
 6
 7
 8
 9
10
11
12
13
14
15
16
17
18
19
20
|
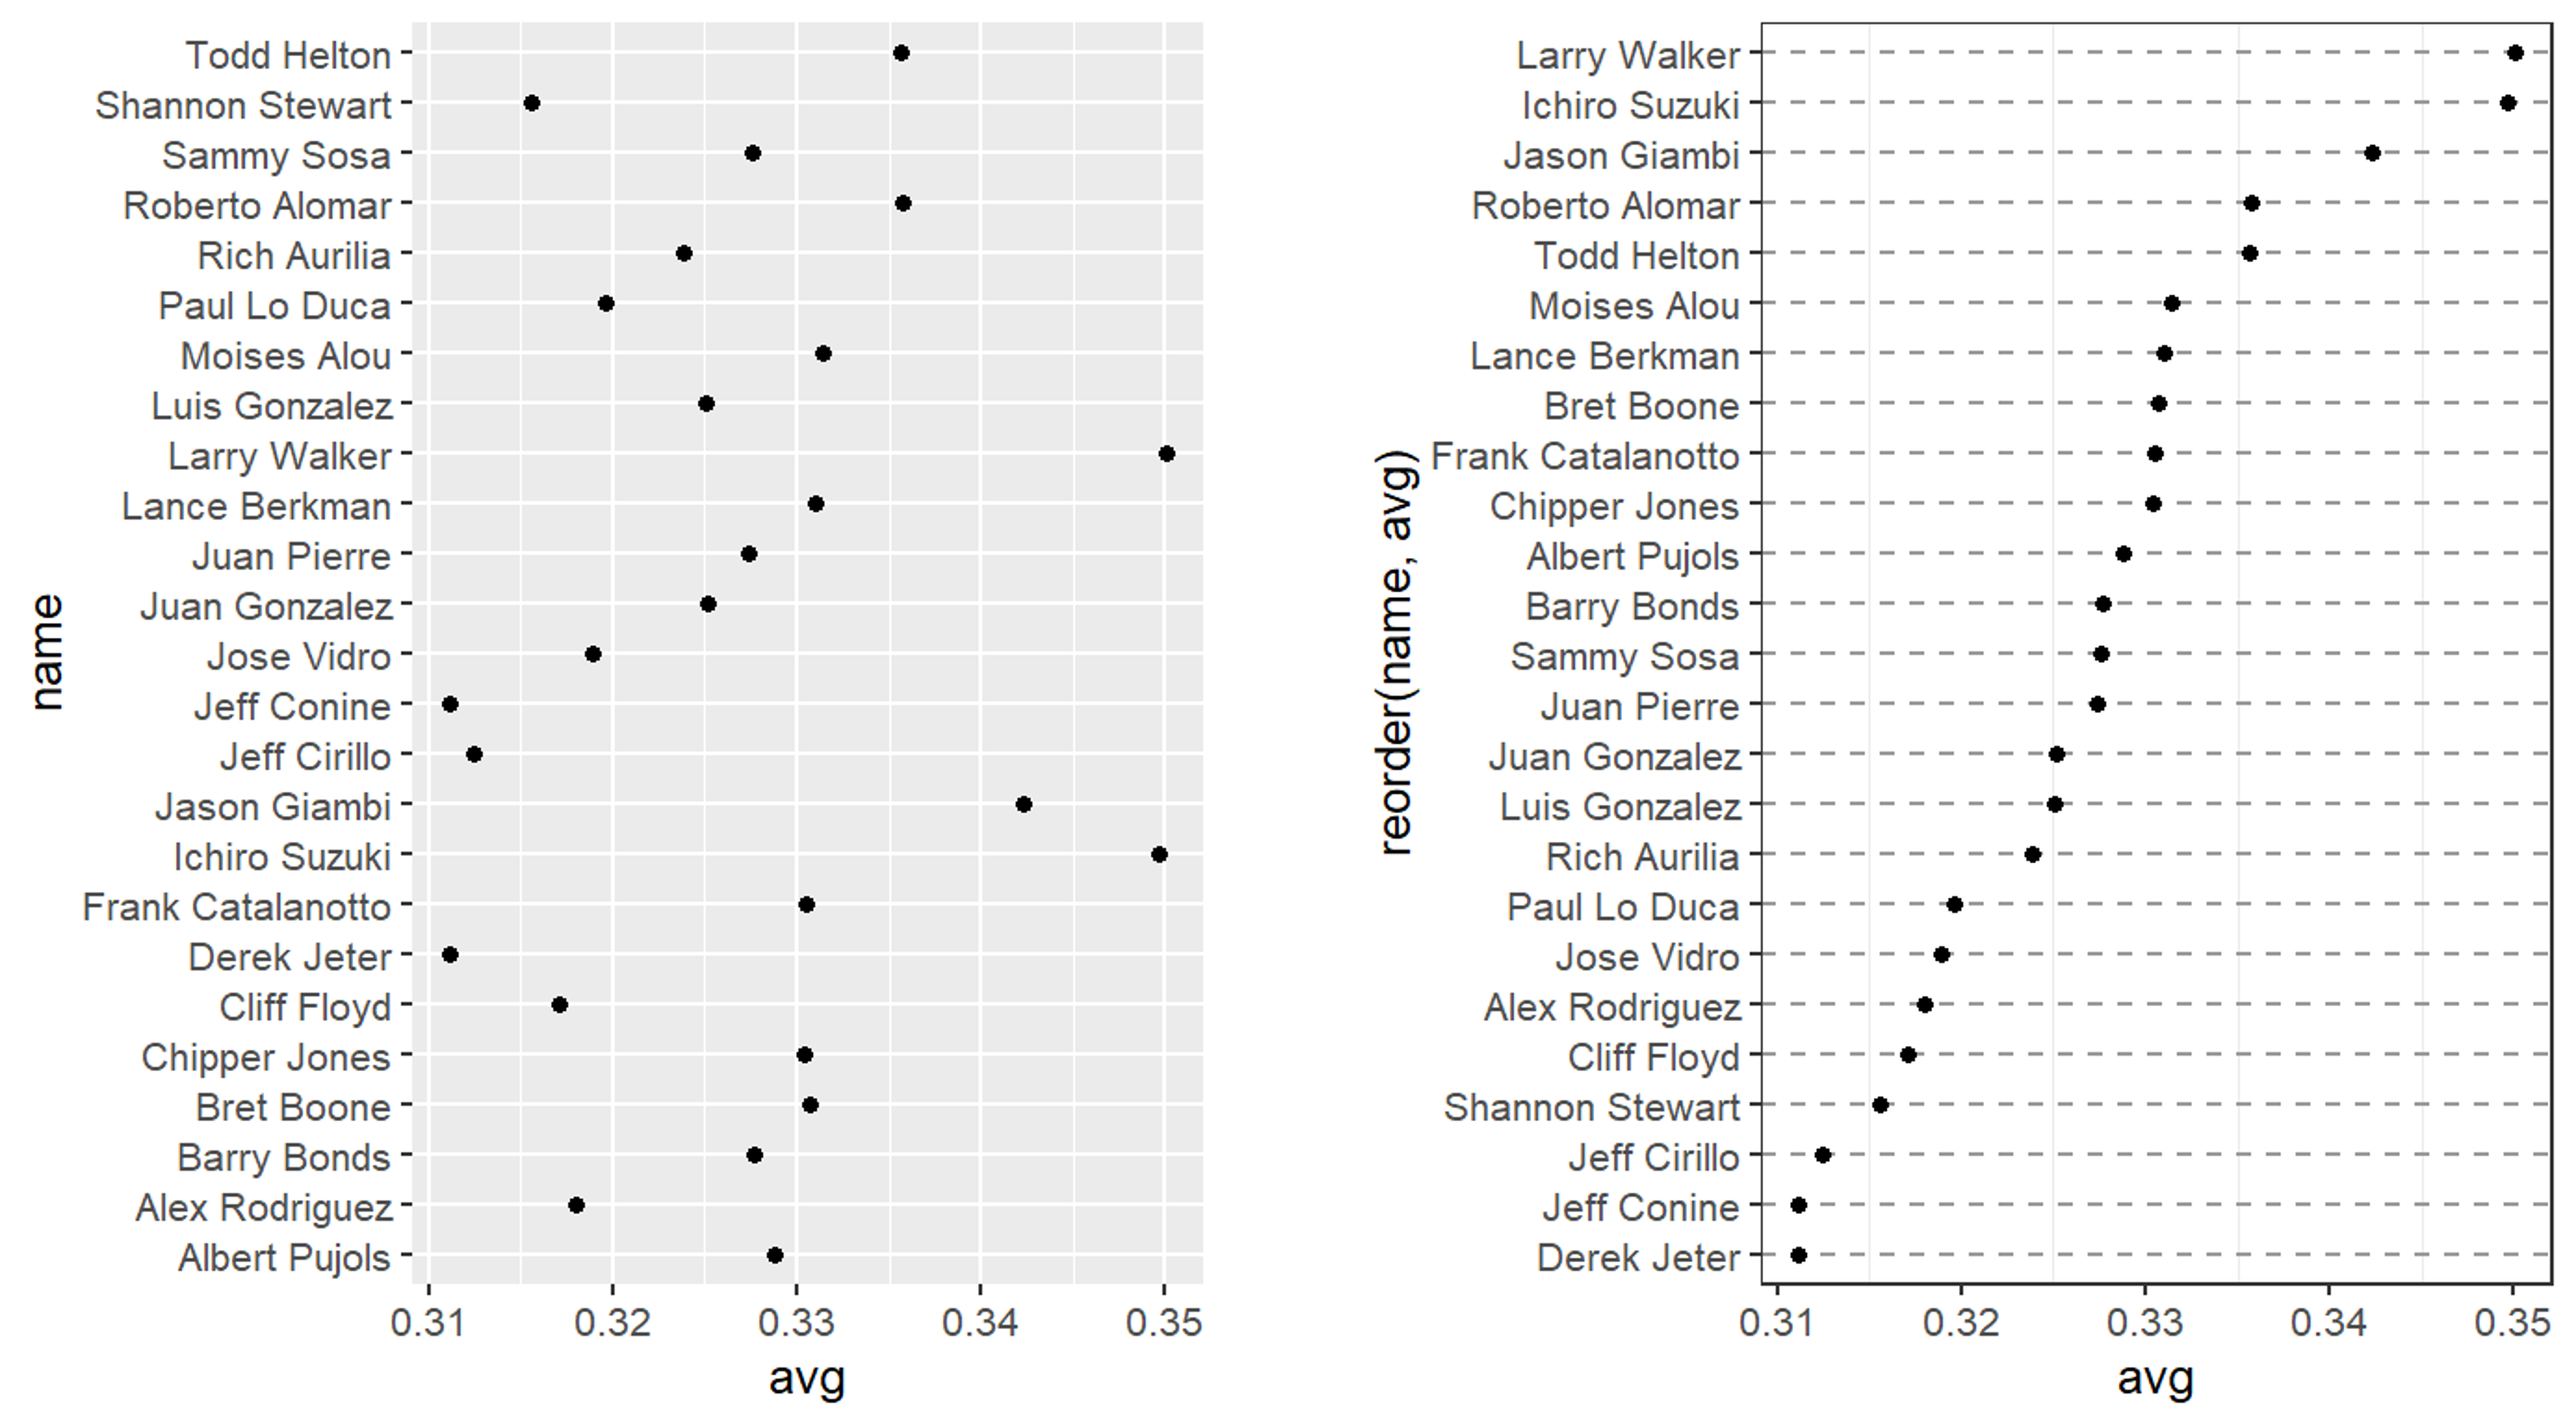
library(gcookbook) # 加载gcookbook数据集包,内置各类绘图示例数据
tophit <- tophitters2001[1:25, ] # 提取数据集前25行,取打击数据前25名球员

# 绘图主体
p<-ggplot(tophit, aes(x = avg, y = name))+
geom_point()
p

# 按照数值使用reorder()进行排序:reorder(y分类, x数值)
# 对绘图进行精修
p<-ggplot(tophit, aes(x = avg, y = reorder(name,avg)))+
geom_point()+
theme_bw()+
theme(
    panel.grid.major.x = element_blank(),
    panel.grid.minor.x = element_blank(),
    panel.grid.major.y = element_line(colour = "grey60", linetype = "dashed")
  )
# panel.grid代表绘图区域内部的网格线,分为major主网格、minor次网格
p
|
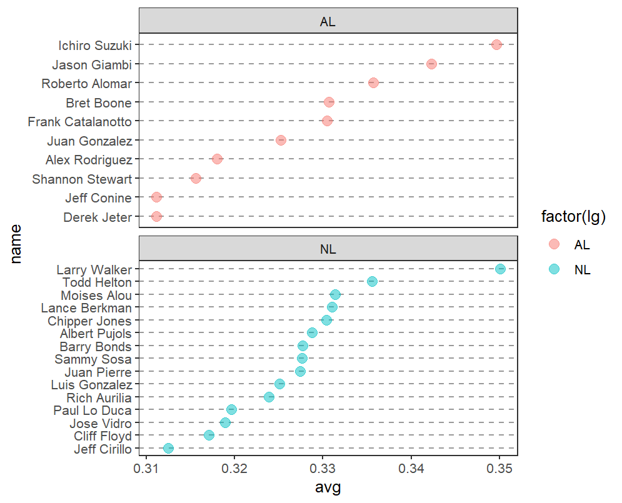
按照 lg 分组绘制克利夫兰点阵图
 1
 2
 3
 4
 5
 6
 7
 8
 9
10
11
12
13
14
|
# 先正确排序name
tophit$name <- reorder(tophit$name, tophit$avg)

p<-ggplot(tophit, aes(x = avg, y = name))+
geom_point(aes(color=factor(lg)), alpha = 0.5, size = 3)+
theme_bw()+
theme(
    panel.grid.major.x = element_blank(),
    panel.grid.minor.x = element_blank(),
    panel.grid.major.y = element_line(colour = "grey60", linetype = "dashed")
  )+
facet_wrap(~lg, ncol=1, scales = "free_y")
# scales="free_y"开启y轴自由,删掉空行
p
|
折线图
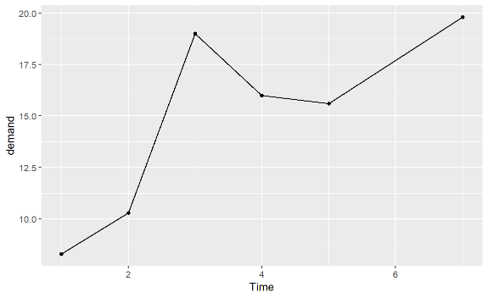
选取内置数据集BOD
 1
 2
 3
 4
 5
 6
 7
 8
 9
10
|
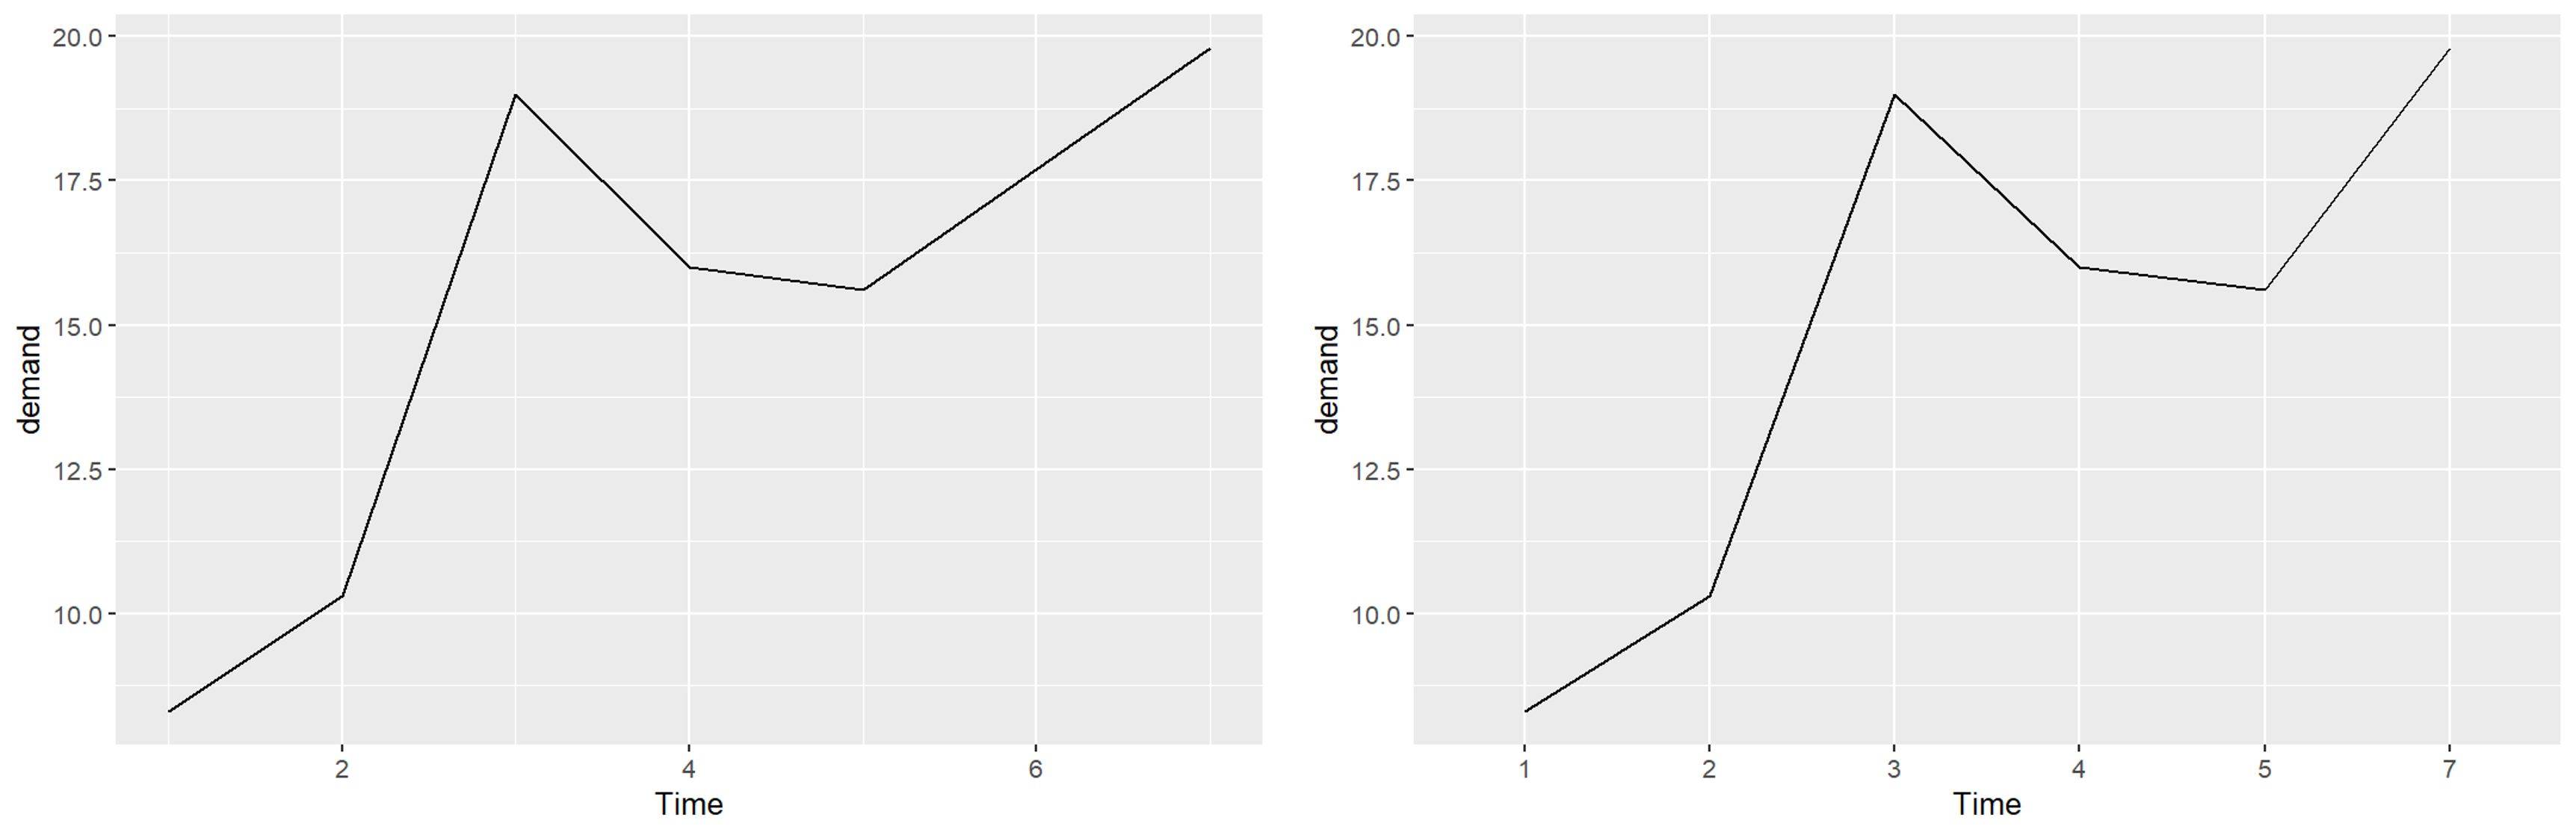
ggplot(BOD, aes(x = Time, y = demand))+
geom_line()

# 设置成因子
BOD1 <- BOD
BOD1$Time <- factor(BOD1$Time)
ggplot(BOD1, aes(x = Time, y = demand, group = 1)) +
geom_line()
# 把 Time 理解成 4 个完全互不相关的类别,每个类别下面只有 1 个样本,group = 1 把全部这些点归为同一组
# 这样绘图横轴无论数值大小是等间距的,每个类别等宽均分
|
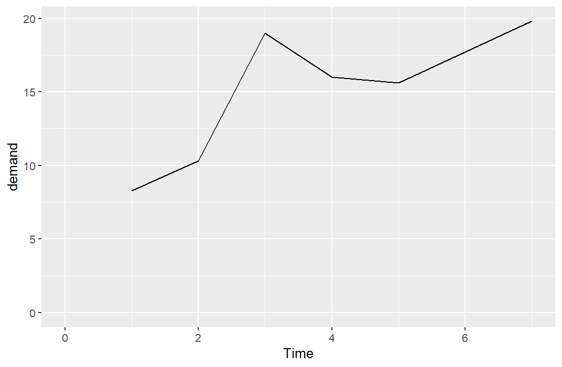
手动设置坐标轴的范围:
1
2
3
4
|
p <- ggplot(BOD, aes(x = Time, y = demand))+
geom_line()+
coord_cartesian(xlim = c(0, max(BOD$Time)), ylim = c(0, max(BOD$demand)))
p
|
1
2
3
4
|
p <- ggplot(BOD, aes(x = Time, y = demand)) +
geom_line() +
geom_point()
p
|
1
2
3
4
5
6
7
8
9
|
library(gcookbook)
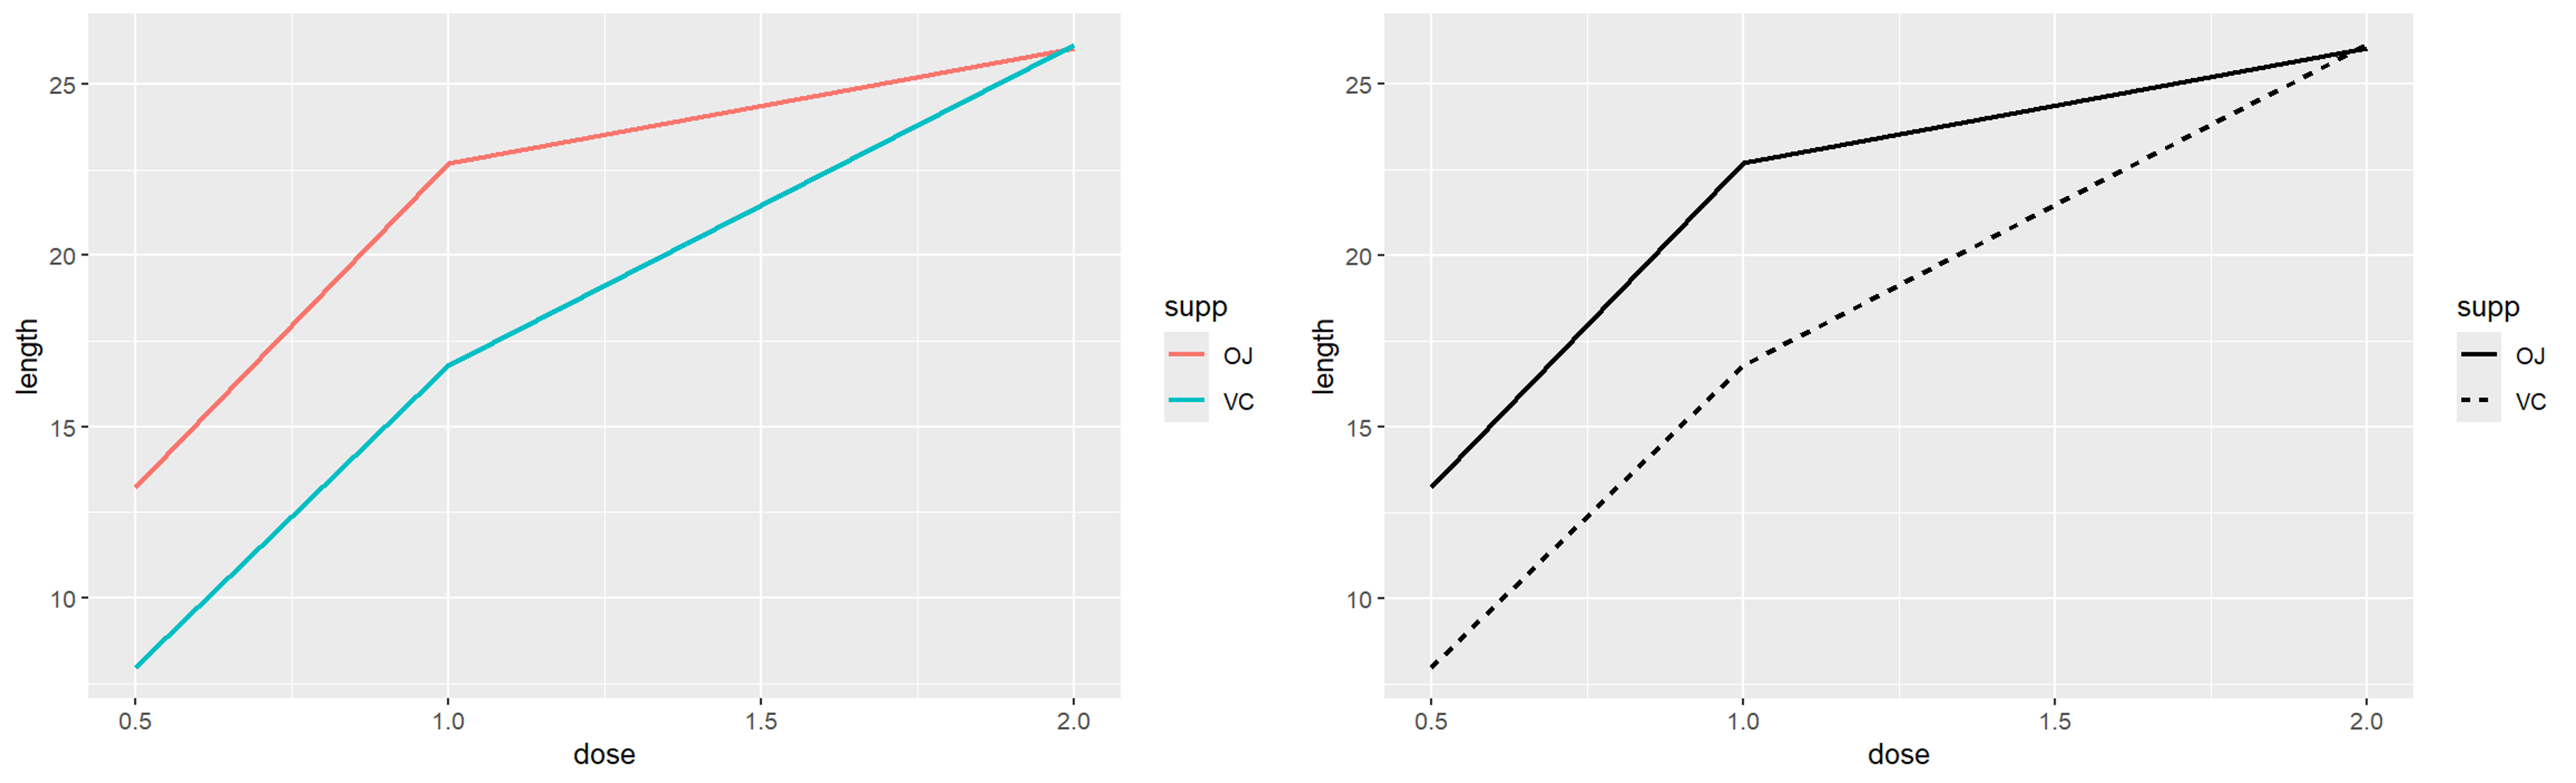
# 分别使用线条颜色和样式区分两组
p <- ggplot(tg, aes(x = dose, y = length, color = supp))+
geom_line(linewidth = 1)
p

p <- ggplot(tg, aes(x = dose, y = length, linetype = supp))+
geom_line(linewidth = 1)
p
|
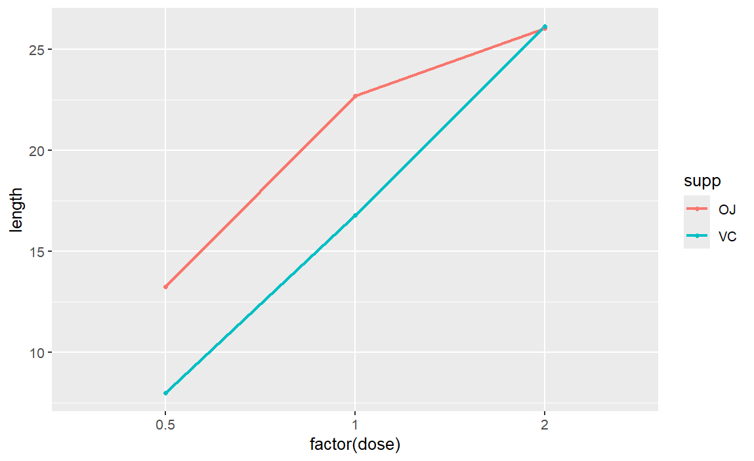
当 x 变量是因子时,把这些当成类别来看待,而不是连续的数值
1
2
3
4
|
p <- ggplot(tg, aes(x = factor(dose), y = length, color = supp, group = supp))+
geom_line(linewidth = 1)+
geom_point(size = 1)
p
|
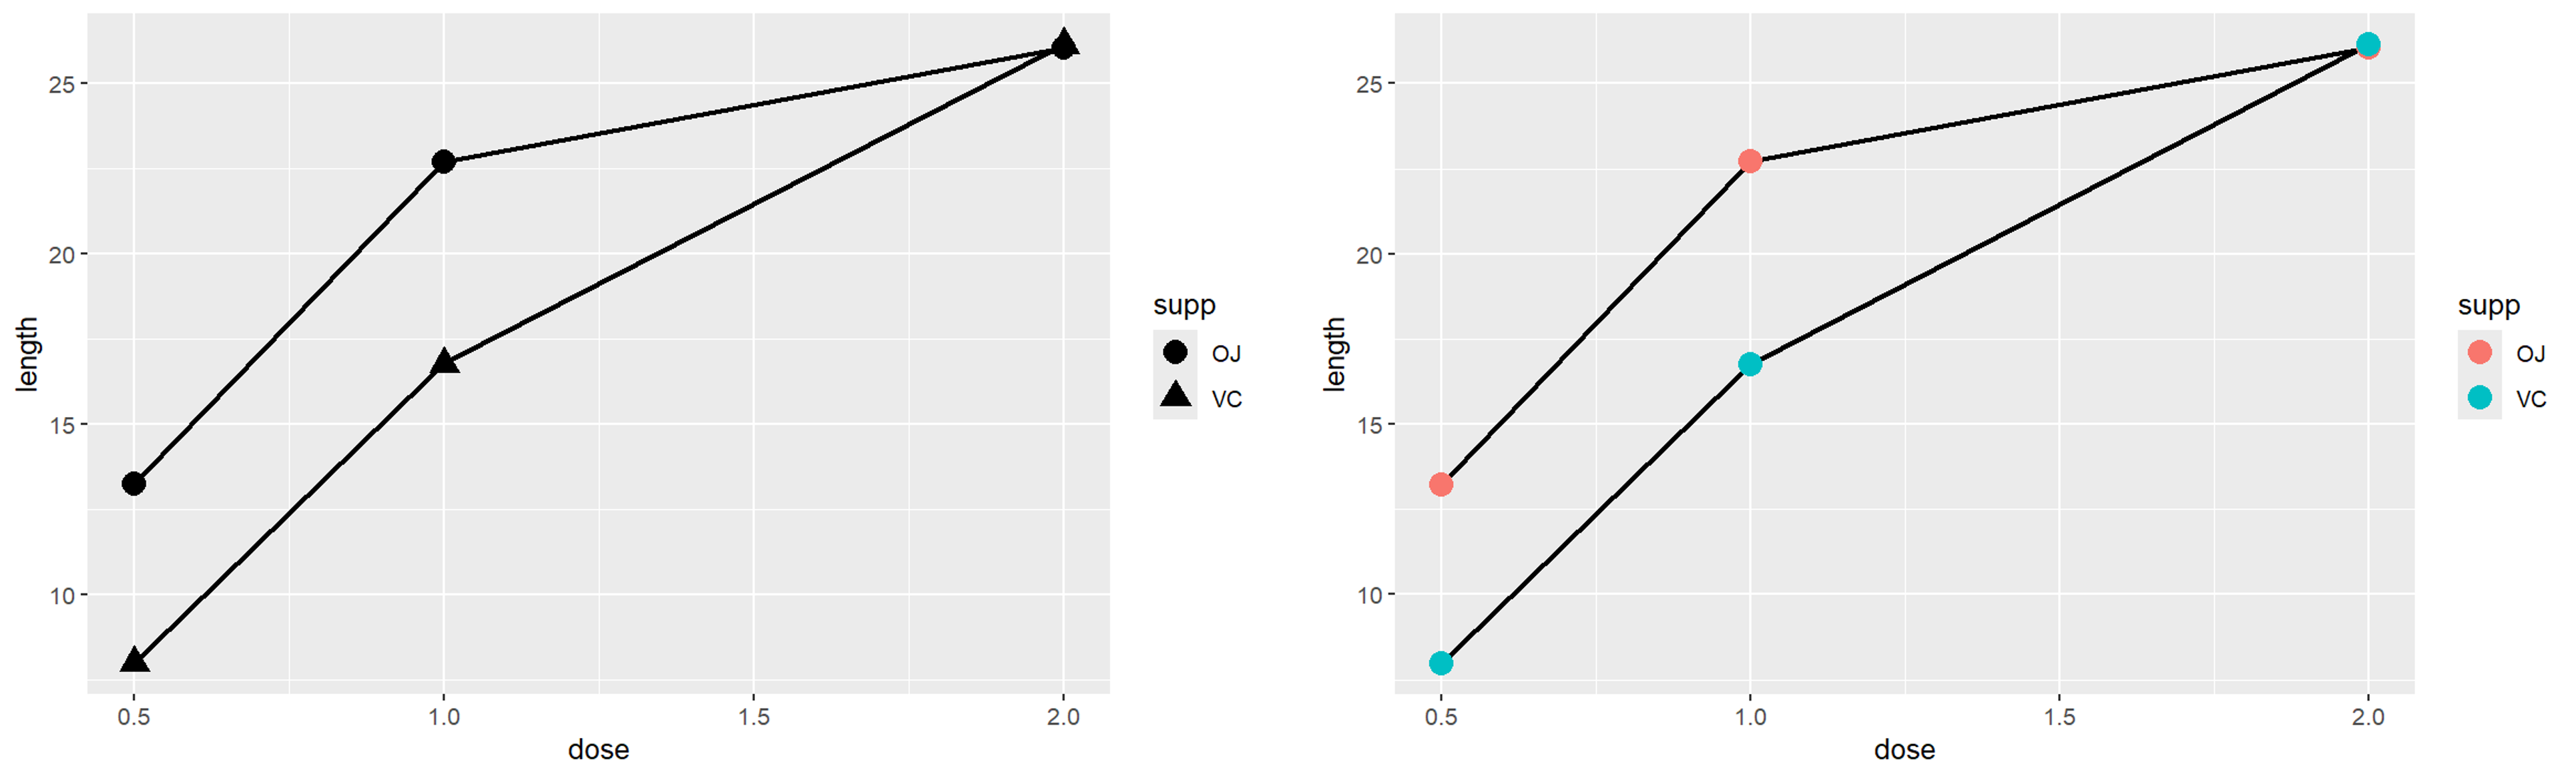
一定要正确分组,否则容易出现一个 x 对应多个 y 值的情况,采取shape、color、fill、linetype等达到目的
1
2
3
4
5
6
7
8
9
|
p <- ggplot(tg, aes(x = dose, y = length, shape = supp))+
geom_line(linewidth = 1)+
geom_point(size = 4)
p

p <- ggplot(tg, aes(x = dose, y = length, fill = supp))+
geom_line(linewidth = 1)+
geom_point(size = 4, aes(color = supp))
p
|
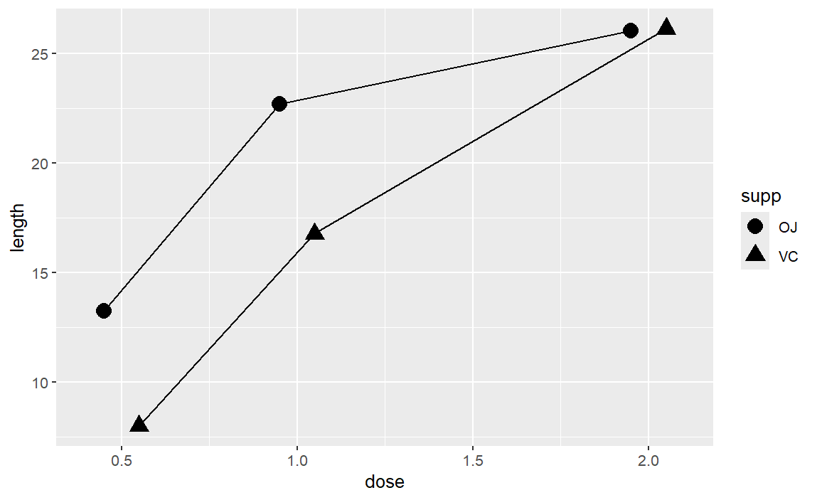
当发现存在点与点之间的重叠时,想避免重叠可以在geom_point()和geom_line中增添position指令
1
2
3
4
|
p <- ggplot(tg, aes(x = dose, y = length, shape = supp)) +
geom_line(position = position_dodge(0.2)) +
geom_point(position = position_dodge(0.2), size = 4)
p
|
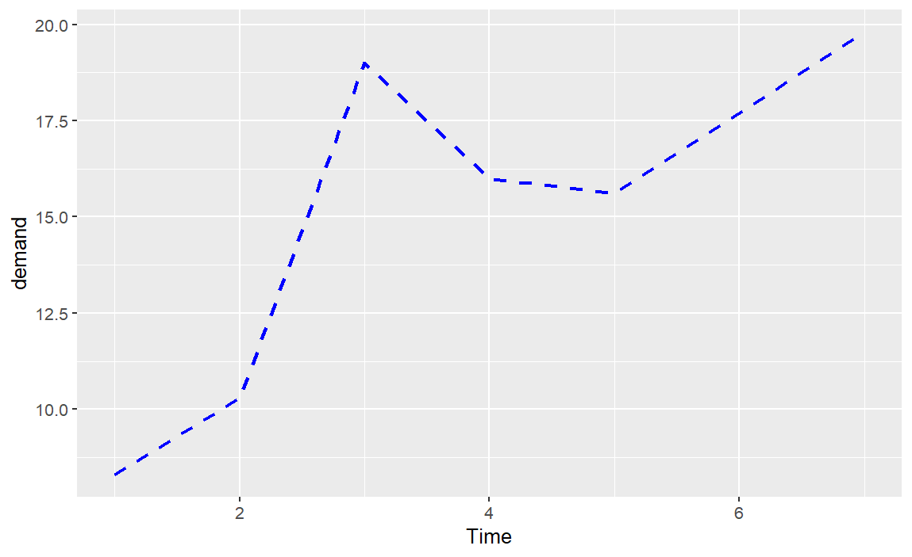
可以调整线条的参数控制来改变折线的外观,如linetype、size、colour、color
1
2
3
4
|
p <- ggplot(BOD, aes(x = Time, y = demand)) +
geom_line(linetype = "dashed", size = 1, colour = "blue")
p
# 绘制虚线
|
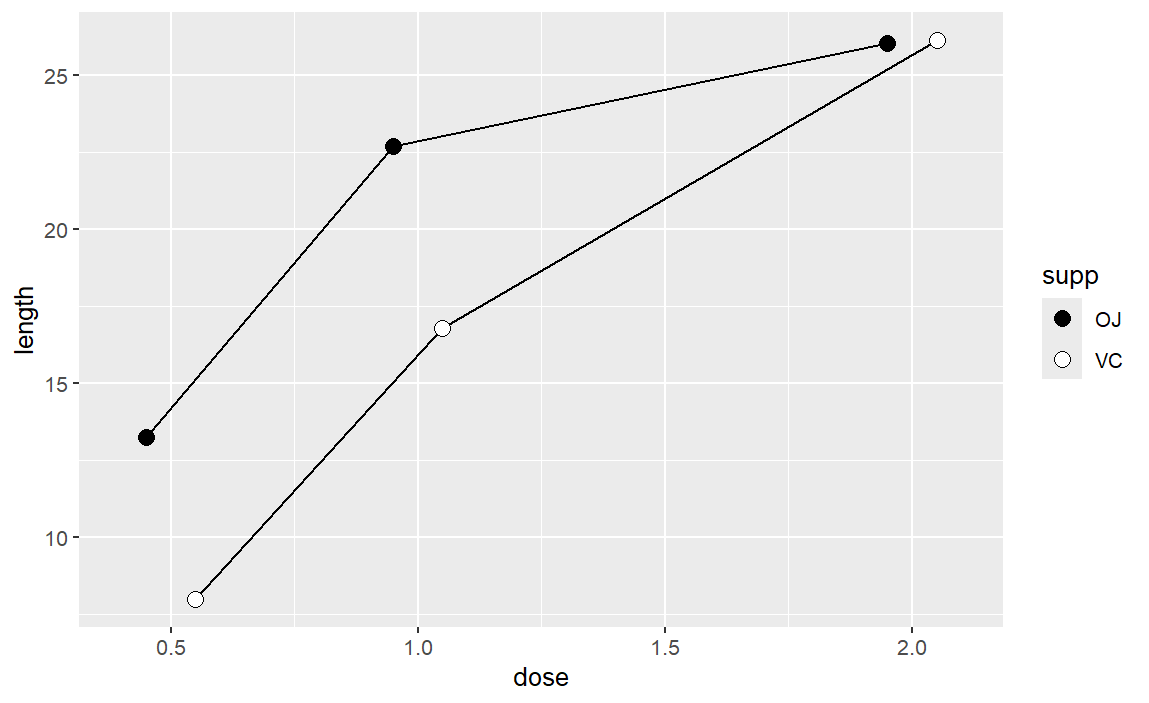
改变点的外观
1
2
3
4
5
6
7
|
library(gcookbook)
pd <- position_dodge(0.2)
p <- ggplot(tg, aes(x = dose, y = length, fill = supp)) +
geom_line(position = pd) +
geom_point(shape = 21, size = 3, position = pd) +
scale_fill_manual(values = c("black","white"))
p
|
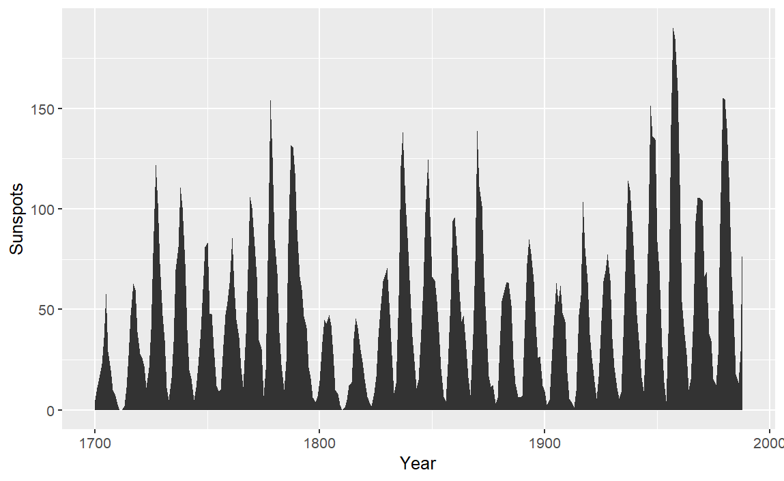
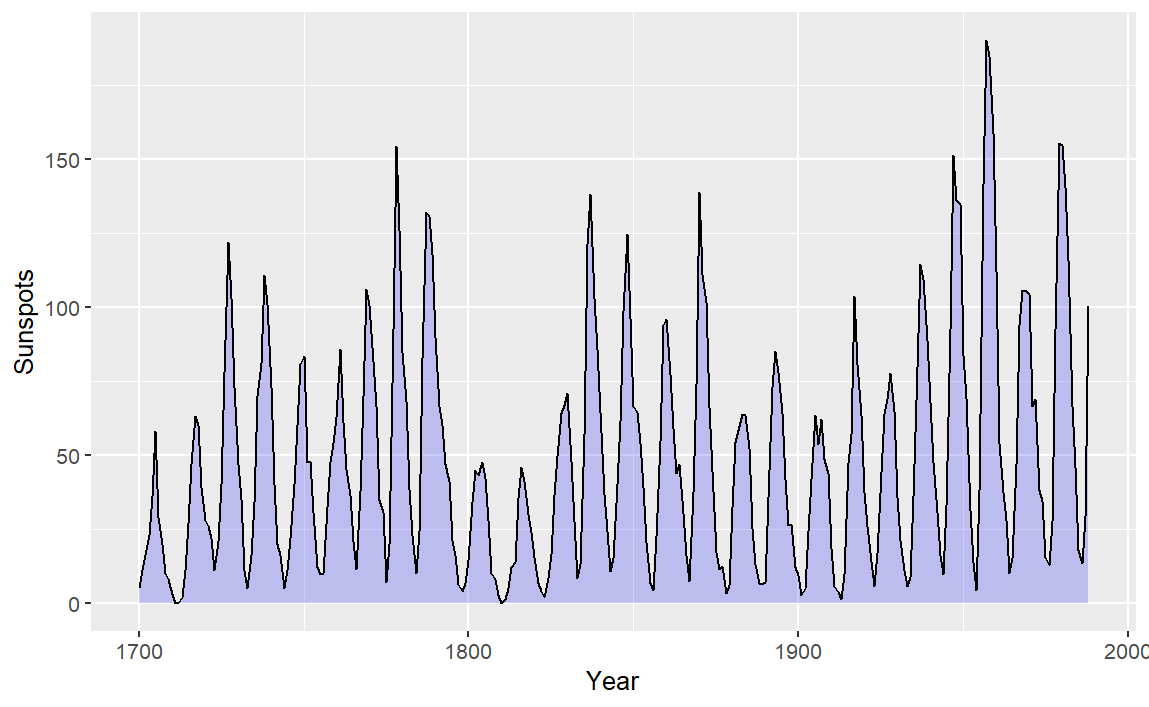
使用geom_area()可以获得阴影区域
1
2
3
4
5
6
7
8
|
# 把 sunsport.year 时间序列转换成数据框类型
sunspotyear <- data.frame(
Year = as.numeric(time(sunspot.year)),
Sunspots = as.numeric(sunspot.year))

p <- ggplot(sunspotyear, aes(x = Year, y = Sunspots)) +
geom_area()
p
|
美化阴影图表,改变轮廓和颜色
1
2
3
4
|
p <- ggplot(sunspotyear, aes(x = Year, y = Sunspots)) +
geom_area(color = "black", fill = "blue", alpha = 0.2)+
geom_line()
p
|
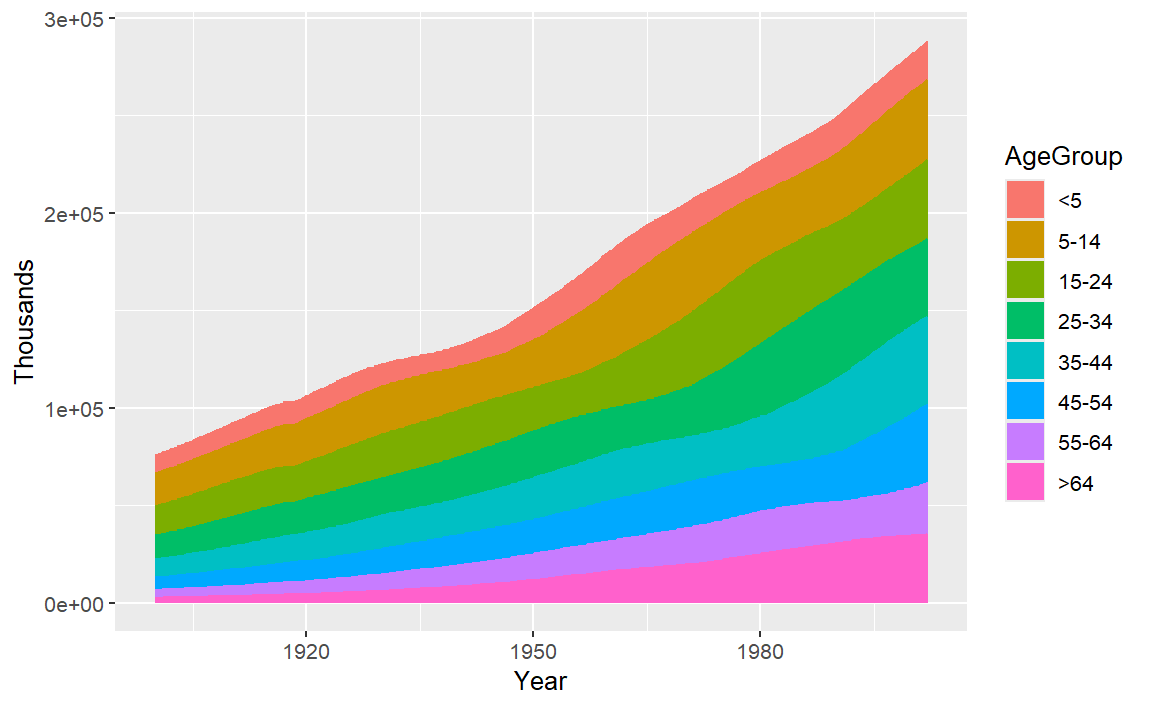
多条面积图,一层层往上摞在一起,每个分组都是从上一组的顶部开始往上画
1
2
3
4
|
library(gcookbook)
p <- ggplot(uspopage, aes(x = Year, y = Thousands, fill = AgeGroup))+
geom_area()
p
|
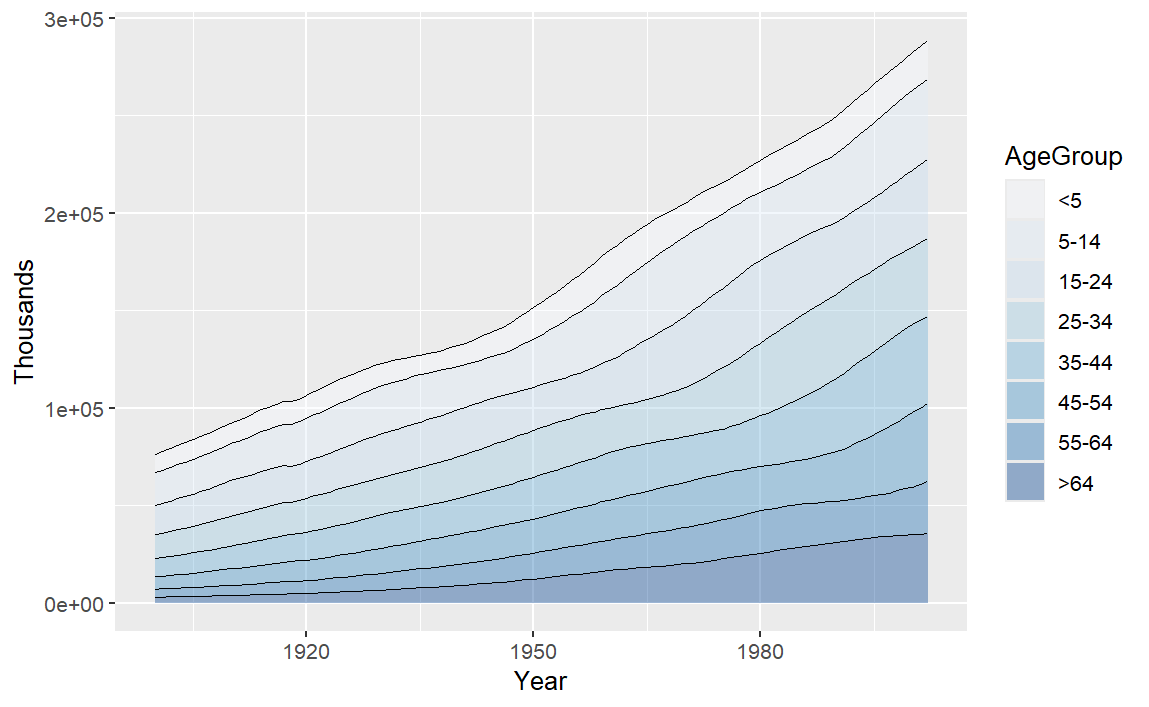
更改为渐变色
1
2
3
4
5
6
7
|
p <- ggplot(uspopage, aes(x = Year, y = Thousands, fill = AgeGroup, order = dplyr::desc(AgeGroup)))+
geom_area(colour = NA, alpha = .4)+
scale_fill_brewer(palette = "Blues")+
geom_line(position = "stack", linewidth = .2)
p
# 使用 RColorBrewer 配色方案,全部使用蓝色系的不同深浅给各个 AgeGroup 分组上色,由于是修改 fill 映射的配色,所以 中间是 fill 而不是 scale_color_brewer
# position = "stack"不同于position = "identity",前者是 y 位置堆叠的画线,而后者是实际 y 数值的画线
|
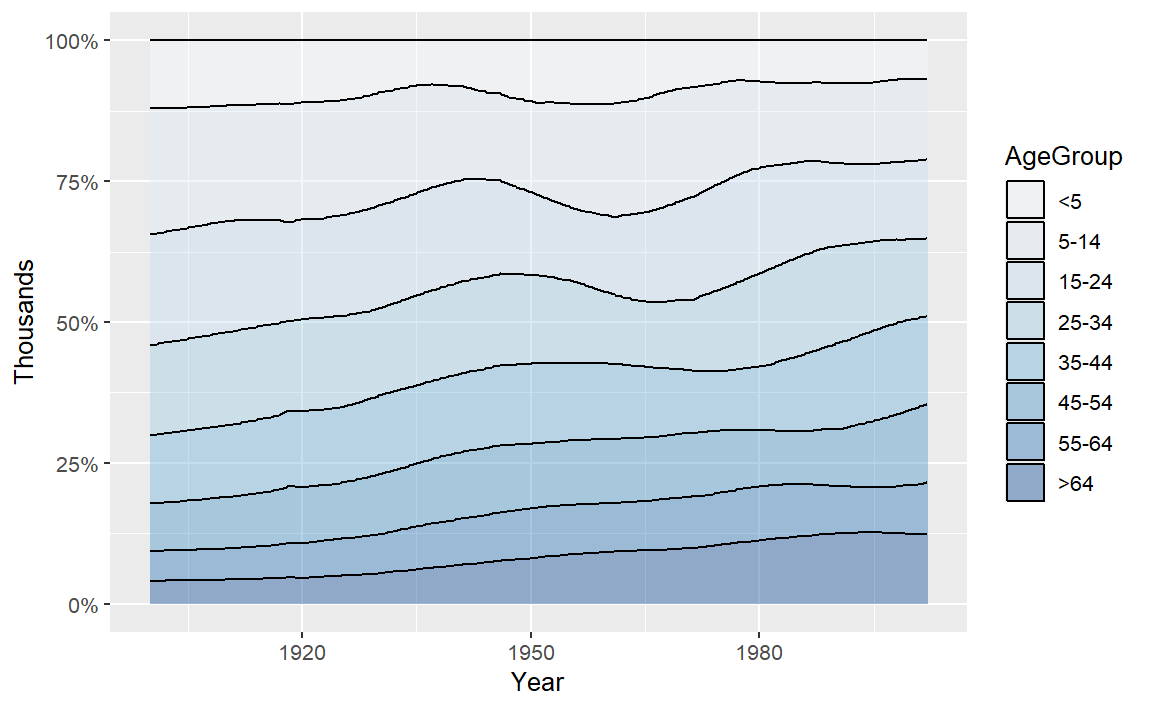
将上述的堆叠面积图再绘制成有一定比例的堆叠面积图
1
2
3
4
5
|
p <- ggplot(uspopage, aes(x = Year, y = Thousands, fill = AgeGroup, order = dplyr::desc(AgeGroup)))+
geom_area(position = "fill", colour = "black", alpha = .4)+
scale_fill_brewer(palette = "Blues")+
scale_y_continuous(labels = scales::percent)
p
|
添加置信区间
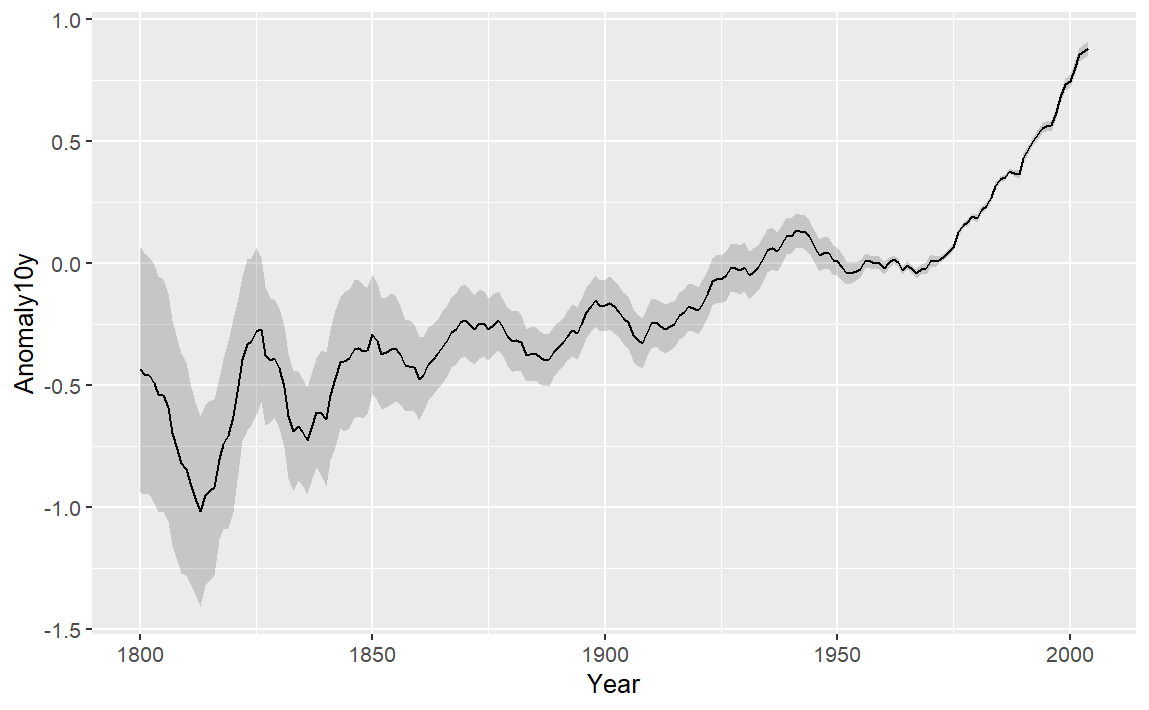
选取 climate 数据集中 1800 年至 2004 年平均温度和 95% 置信区间。
 1
 2
 3
 4
 5
 6
 7
 8
 9
10
11
|
# 数据预处理
library(gcookbook)
library(tidyverse)
climate_mod <- climate %>%
filter(Source == "Berkeley") %>%
select(Year, Anomaly10y, Unc10y)

p <- ggplot(climate_mod, aes(x = Year, y = Anomaly10y))+
geom_ribbon(aes(ymin = Anomaly10y - Unc10y, ymax = Anomaly10y + Unc10y), alpha = .2)+
geom_line()
p
|
拟合回归
要向散点图添加线性回归线,需要添加不同组件:stat_smooth()、method = lm lm() sp
如下为普通绘图:
1
2
3
4
5
6
7
8
9
|
library(gcookbook)
p <- ggplot(heightweight, aes(x = ageYear, y = heightIn))+
geom_point() +
stat_smooth(method = lm)
p
# 注意一定要加 method = lm 表示普通线性回归,否则默认为method = "loess" 局部加权非线性平滑
# 默认是 level = 0.95 95%置信区间
# stat_smooth(method = lm, level = 0.99) 99%置信区间
# stat_smooth(method = lm, se = FALSE) 无置信区间
|
更改点和线的颜色
1
2
3
4
|
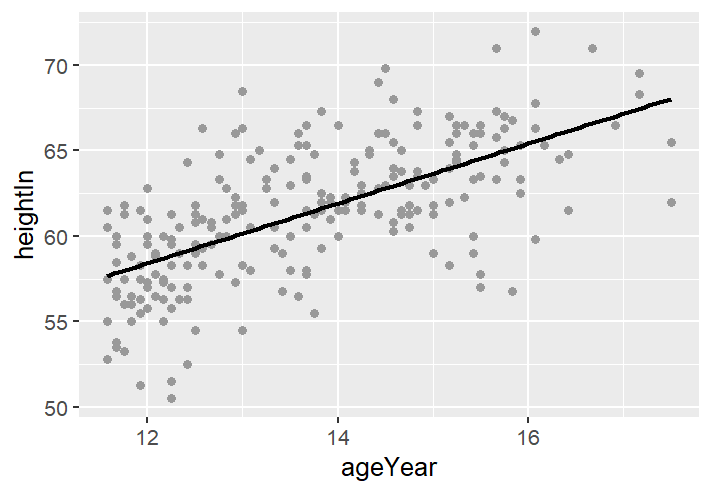
p <- ggplot(heightweight, aes(x = ageYear, y = heightIn))+
geom_point(color = "grey60") +
stat_smooth(method = lm, se = FALSE, color = "black")
p
|
 1
 2
 3
 4
 5
 6
 7
 8
 9
10
11
|
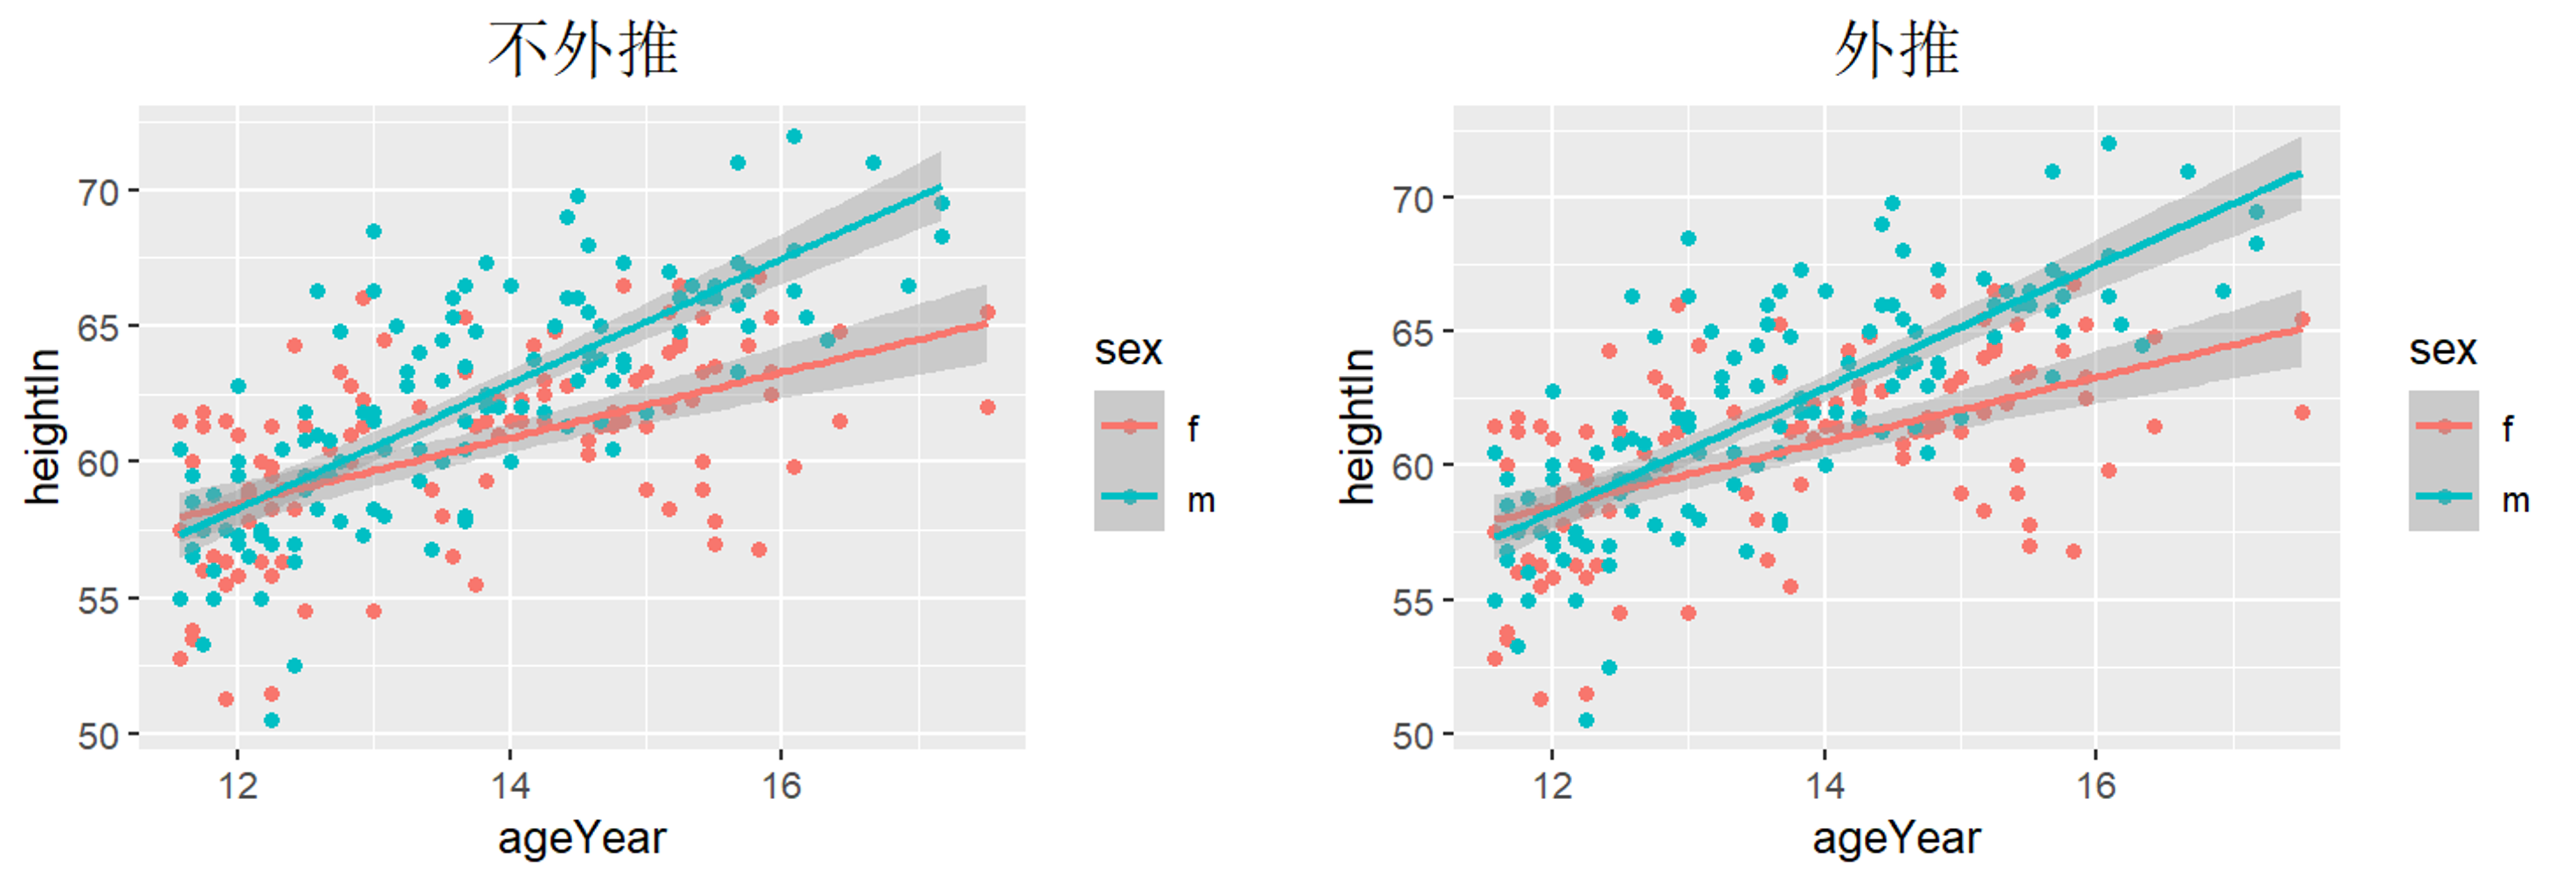
p <- ggplot(heightweight, aes(x = ageYear, y = heightIn, color = sex))+
geom_point()+
geom_smooth(method = lm, fullrange = TRUE)+
labs(title = "外推")+
  theme(
    plot.title = element_text(
      size = 16,
      hjust = 0.5,
      vjust = 1,
      color = "black"))
p
|
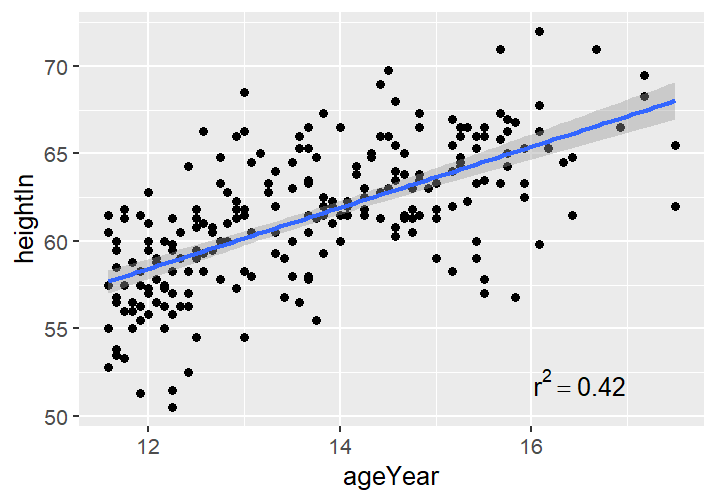
要为图中添加简单文本,只需添加注释即可。可以通过线性拟合明确拟合的解释度 $R^2$ ,再添加到拟合图中
 1
 2
 3
 4
 5
 6
 7
 8
 9
10
11
|
library(gcookbook)
model <- lm(heightIn ~ ageYear, heightweight)
# lm(y ~ x, data)
summary(model)

p <- ggplot(heightweight, aes(x = ageYear, y = heightIn))+
geom_point()+
geom_smooth(method = lm)+
annotate("text", x = 16.5, y = 52, label = "r^2 == 0.42", parse = TRUE)
p
# parse = TRUE 告诉 R label里面是的数学表达式而非文本
|
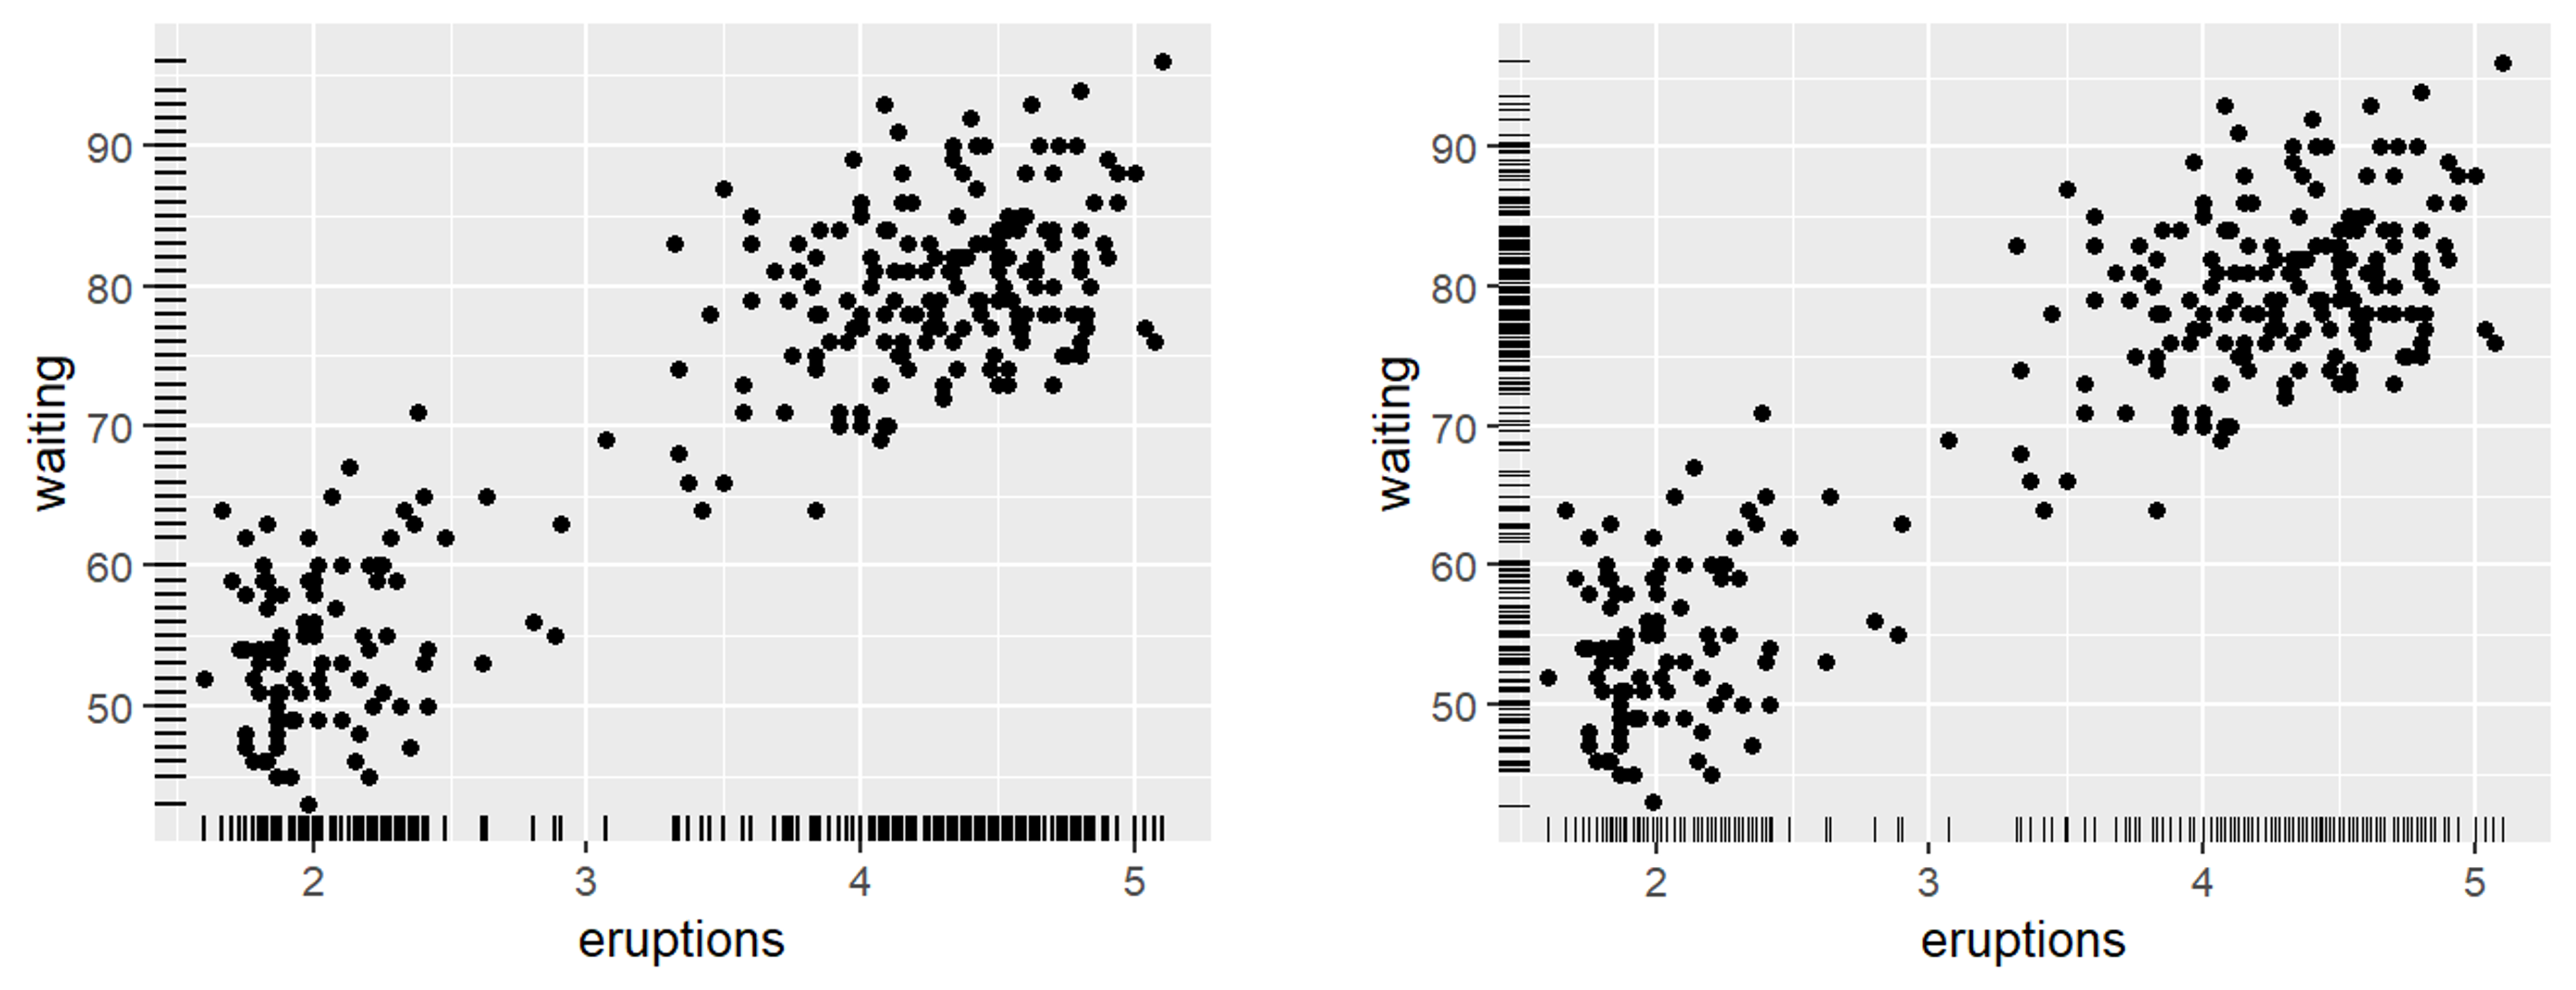
边缘地毯图
边缘地毯图本质上是一种一维散点图,可用于可视化数据在每个轴上的分布。
 1
 2
 3
 4
 5
 6
 7
 8
 9
10
|
p <- ggplot(faithful, aes(x = eruptions, y = waiting)) +
geom_point() +
geom_rug()
p

# 指定尺寸来调整线的位置
p <- ggplot(faithful, aes(x = eruptions, y = waiting)) +
geom_point() +
geom_rug(position = "jitter", size = 0.2)
p
|
标记点
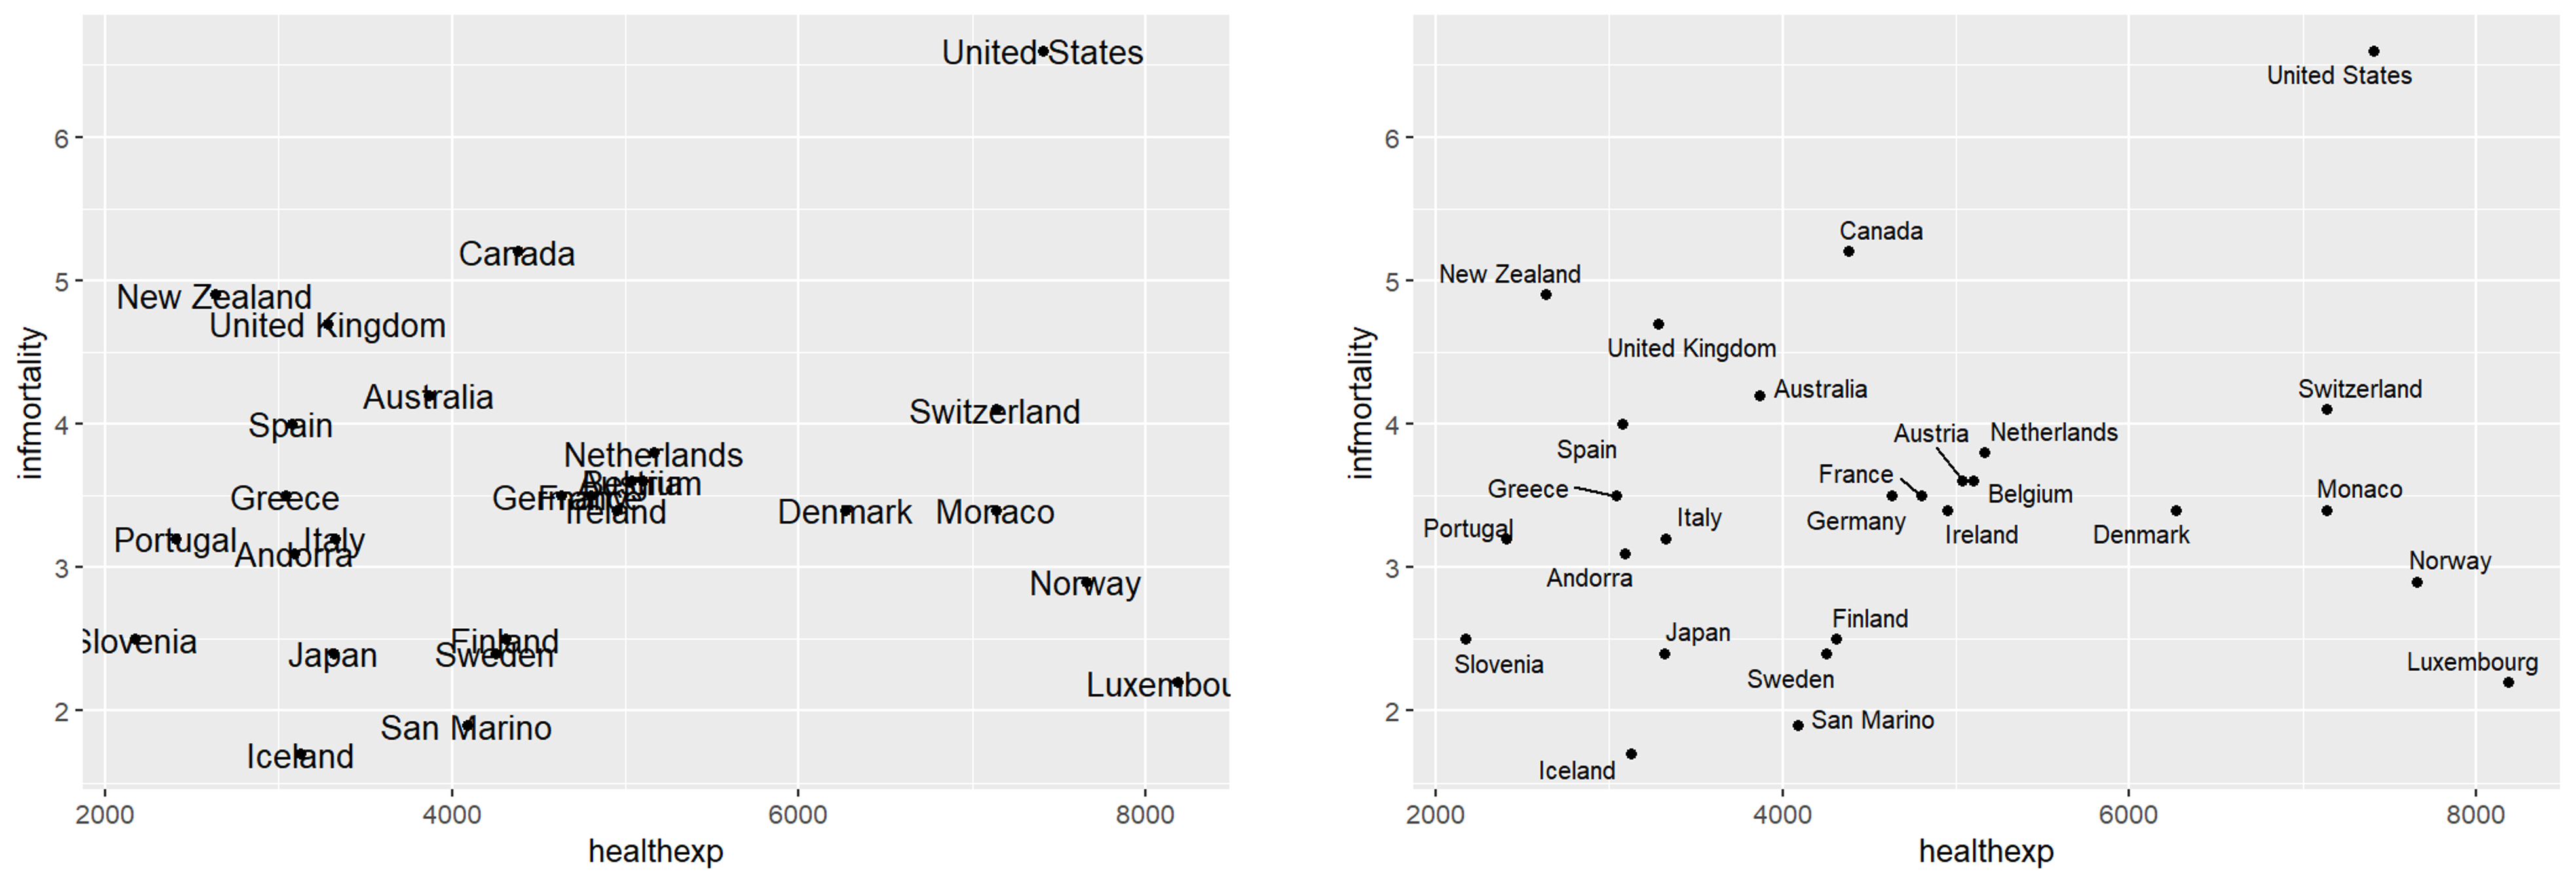
想要给散点图中的点添加标签,使用 annotate 时要指定坐标和标签,需要反复调整,因此使用 geom_text 。
 1
 2
 3
 4
 5
 6
 7
 8
 9
10
11
12
13
14
15
16
|
# 先筛选数据
countries_sub <- countries %>%
filter(Year == 2009 & healthexp > 2000)

# 重叠情况明显
p <- ggplot(countries_sub, aes(x = healthexp, y = infmortality))+
geom_point()+
geom_text(aes(label = Name), size = 4)
p

# 使用 ggrepel 包中 geom_text_repel() 函数代替 geom_text()
library(ggrepel)
p <- ggplot(countries_sub, aes(x = healthexp, y = infmortality))+
geom_point()+
geom_text_repel(aes(label = Name), size = 3)
p
|
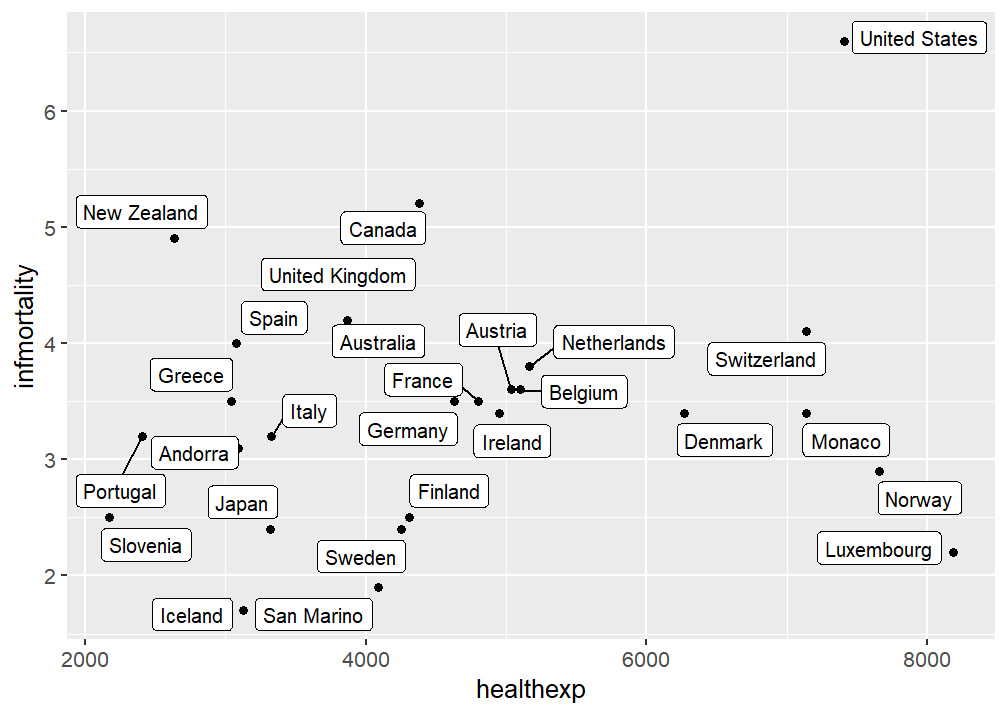
同样地还可以用 geom_label_repel() 为标签增添一个外框
1
2
3
4
|
p <- ggplot(countries_sub, aes(x = healthexp, y = infmortality))+
geom_point()+
geom_label_repel(aes(label = Name), size = 3)
p
|
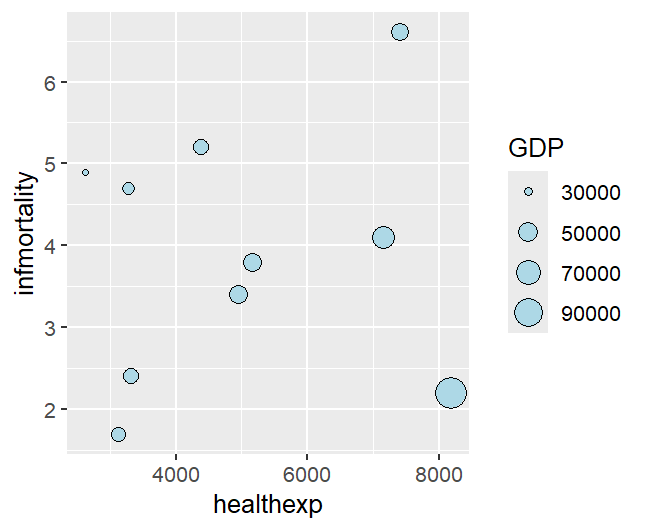
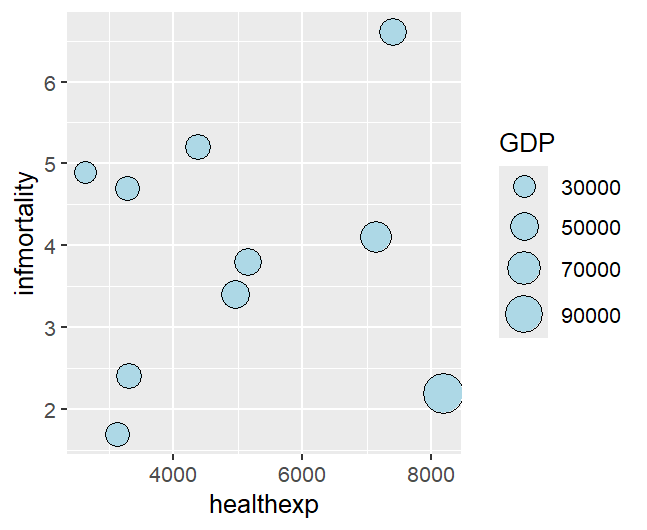
气球图
气球图由 x、y 决定点的位置,size 映射第三个数值变量
 1
 2
 3
 4
 5
 6
 7
 8
 9
10
|
library(gcookbook)
countrylist <- c("Canada", "Ireland", "United Kingdom", "United States", "New Zealand", "Iceland", "Japan", "Luxembourg", "Netherlands", "Switzerland")
cdat <- countries %>%
filter(Year == 2009 & Name %in% countrylist)

p <- ggplot(cdat, aes(x = healthexp, y = infmortality, size = GDP))+
geom_point(shape = 21, color = "black", fill = "lightblue")
p
# 注意这里绘制点的时候一定要有 shape = 21,因为默认点的形状是 shape = 19 实心原点;
# 而 shape = 21 是带边框的圆点
|
注意上面代码直接映射 size 是控制点的半径,要想与面积成正比需要采用 scale_size_area()
1
2
3
4
|
p <- ggplot(cdat, aes(x = healthexp, y = infmortality, size = GDP))+
geom_point(shape = 21, color = "black", fill = "lightblue")+
scale_size_area(max_size = 8)
p
|
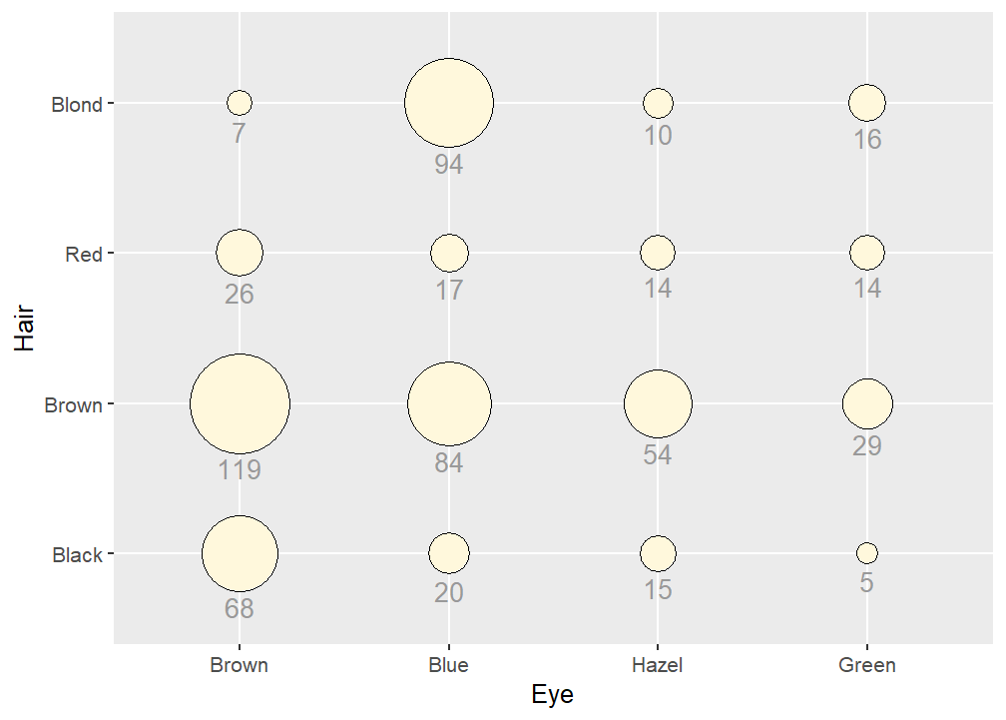
使用气球图在网格上表示数值也很有用,其中 x 轴和 y 轴为类别
 1
 2
 3
 4
 5
 6
 7
 8
 9
10
11
12
13
14
15
16
17
18
19
20
21
22
|
hec <- as.data.frame(HairEyeColor)
#    Hair   Eye  Sex Freq
# 1 Black Brown Male   32
# 2 Brown Brown Male   53
# 3   Red Brown Male   10 ……

# 不分性别地合并相同发色和眼色
hec_total <- hec %>%
group_by(Hair, Eye) %>%
summarise(total = sum(Freq), .groups = "drop")
# summarise() 按组压缩数据,每组输出 1 行,生成新的汇总列
# .groups="drop" 全部取消分组,返回普通无分组 tibble

p <- ggplot(hec_total, aes(x = Eye, y = Hair, size = total))+
geom_point(shape = 21, colour = "black", fill = "cornsilk")+
scale_size_area(max_size = 20, guide = FALSE)+
geom_text(
aes(y = as.numeric(as.factor(Hair)) - sqrt(total)/34, label = total),
vjust = 1.3,
size = 4,
colour = "grey60")
p
|
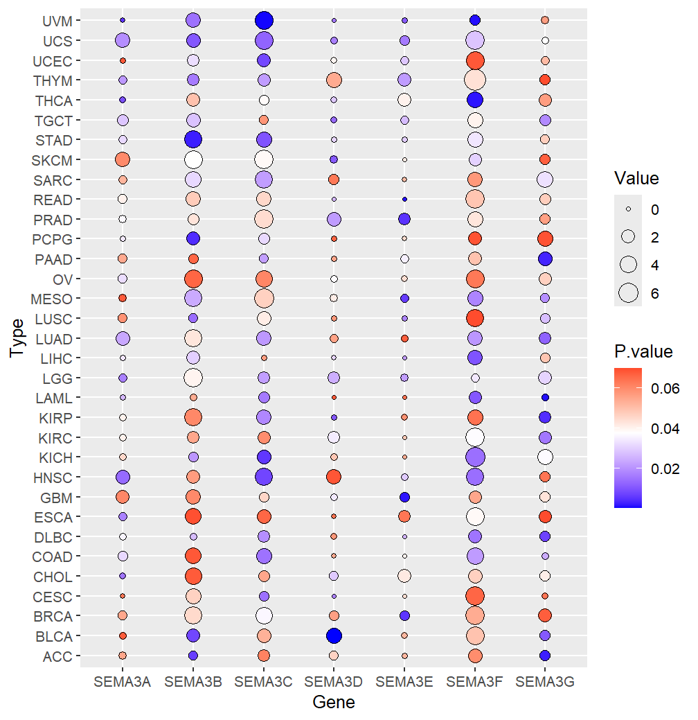
如下一个不同癌症中重点基因的表达上调和下调情况,数据集为data,行名为癌症类型,列名为基因
 1
 2
 3
 4
 5
 6
 7
 8
 9
10
11
12
13
14
15
16
17
18
19
20
21
22
23
24
25
|
# 数据预处理
library(tidyverse)
data$Type <- rownames(data)
data1 <- data %>%
  pivot_longer(
	cols = -Type, # 除去Type这列全部要拉长
	names_to = "Gene",
    values_to = "Value"
)
# pivot_longer() 用于宽表格 → 长表格

data1$P.value <- runif(length(rownames(data1)), 0, 0.07)
# 随机数生成P值,方便演示
# 准备好的数据框data1分为4列:Type, Gene, Value, P.value

# 绘制气泡图,渐变颜色是 P.value 大小,气泡大小是值的大小
p <- ggplot(data1, aes(x = Gene, y = Type))+
geom_point(shape = 21, aes(fill = P.value, size = Value))+
scale_size_continuous(range = c(1,6))+
scale_fill_gradient2(
    low = "blue",
    mid = "white",
    high = "red",
    midpoint = median(data1$P.value))
p
|
ps. 对比区分:
scale_fill_gradient() |
单向连续渐变 |
scale_fill_gradient2() |
发散渐变,有中间零点 |
scale_fill_manual() |
只用于离散分类变量 |
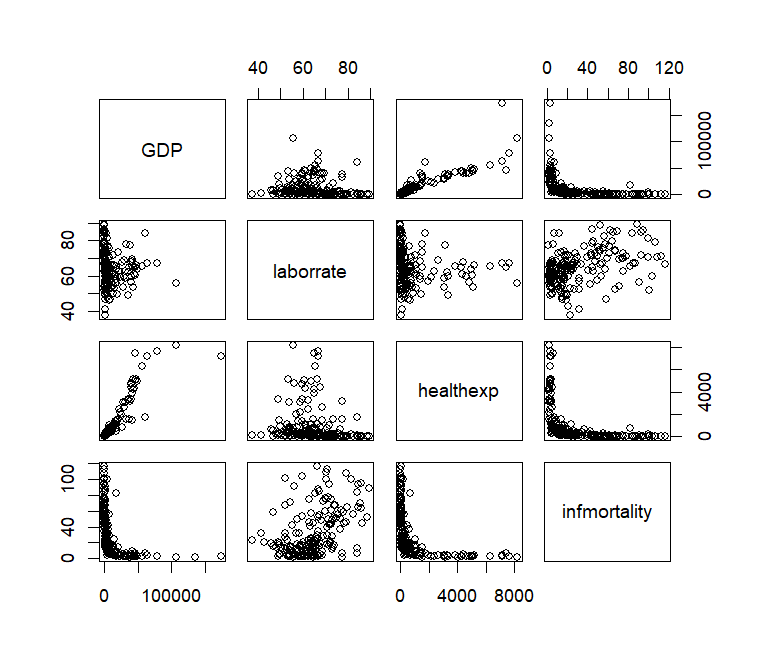
散点矩阵图
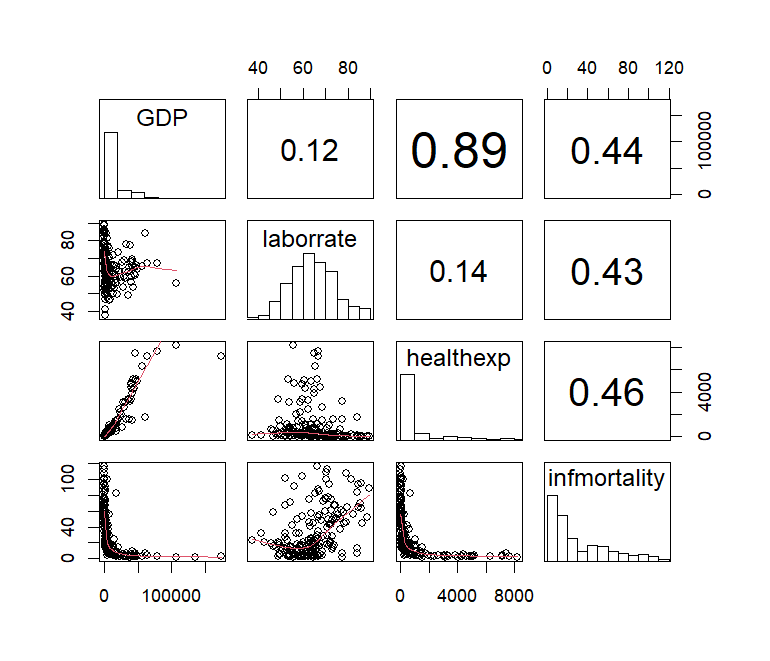
散点矩阵图是把多组数值变量,两两全部画散点图,拼成一个矩阵网格,直接使用内置的 pairs() 函数即可
1
2
3
4
5
6
7
8
|
library(gcookbook)
c2009 <- countries %>%
  filter(Year == 2009) %>%
  select(Name, GDP, laborrate, healthexp, infmortality)

# 使用除了 name 以外的所有变量
c2009_num <- select(c2009, -Name)
pairs(c2009_num)
|
使用自定义,显示每对变量的相关系数而非散点图,同时对角线显示每个变量的直方图,由此定义下列函数绘图
 1
 2
 3
 4
 5
 6
 7
 8
 9
10
11
12
13
14
15
16
17
18
19
20
21
22
23
24
25
26
27
28
29
30
|
panel.cor <- function(x, y, digits = 2, prefix = "", cex.cor, ...) {
  usr <- par("usr")
  on.exit(par(usr))
  par(usr = c(0, 1, 0, 1))
  r <- abs(cor(x, y, use = "complete.obs"))
  txt <- format(c(r, 0.123456789), digits = digits)[1]
  txt <- paste(prefix, txt, sep = "")
  if (missing(cex.cor)) cex.cor <- 0.8/strwidth(txt)
  text(0.5, 0.5, txt, cex =  cex.cor * (1 + r) / 2)
}

panel.hist <- function(x, ...) {
  usr <- par("usr")
  on.exit(par(usr))
  par(usr = c(usr[1:2], 0, 1.5) )
  h <- hist(x, plot = FALSE)
  breaks <- h$breaks
  nB <- length(breaks)
  y <- h$counts
  y <- y/max(y)
  rect(breaks[-nB], 0, breaks[-1], y, col = "white", ...)
}

# 绘图部分增添 loess 平滑线
pairs(
  c2009_num,
  upper.panel = panel.cor,
  diag.panel  = panel.hist,
  lower.panel = panel.smooth
)
|
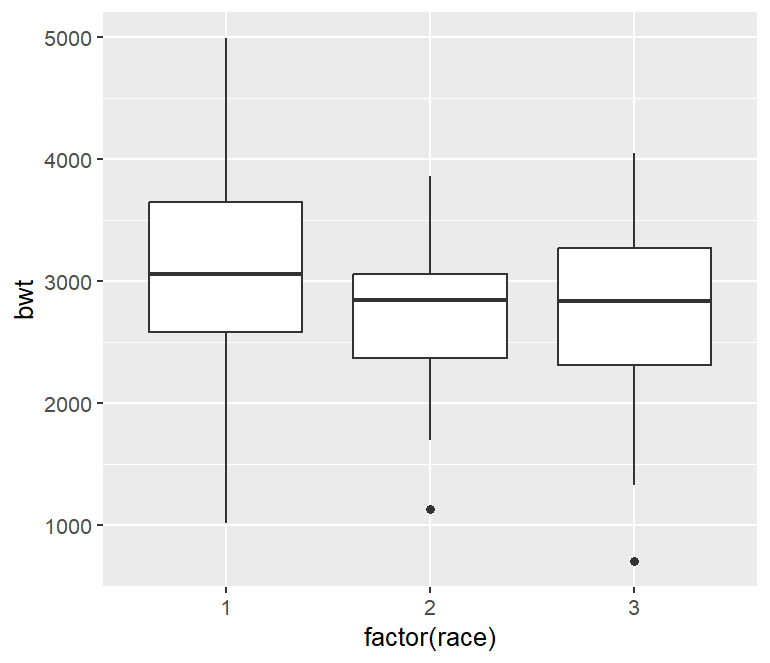
盒状图
1
2
3
4
5
6
7
|
library(MASS)
p <- ggplot(birthwt, aes(x = factor(race), y = bwt))+
geom_boxplot()
p
# 一定要转变成 factor 类型,变成离散因子,才能分组统计画箱子
# 这里 geom_boxplot() 里面可以 width = 0.5 为例调整宽度
# 更改离群点的大小和形状:outlier.size = 1.5, outlier.shape = 21
|
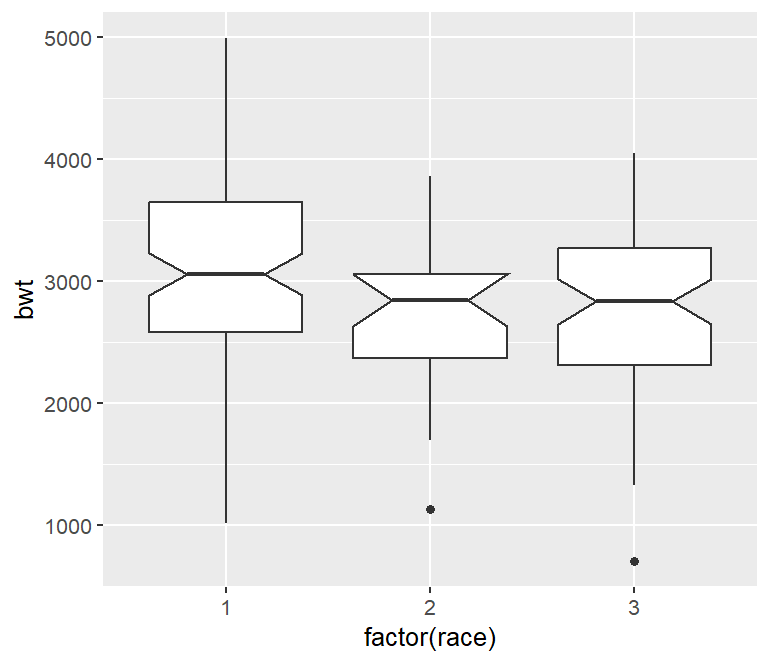
在箱线图上添加刻度可以来评估中位数是否不同
1
2
3
4
|
p <- ggplot(birthwt, aes(x = factor(race), y = bwt))+
geom_boxplot(notch = TRUE)
# notch = TRUE 表示画缺口箱线图,初步比较中位数差异是否显著
p
|
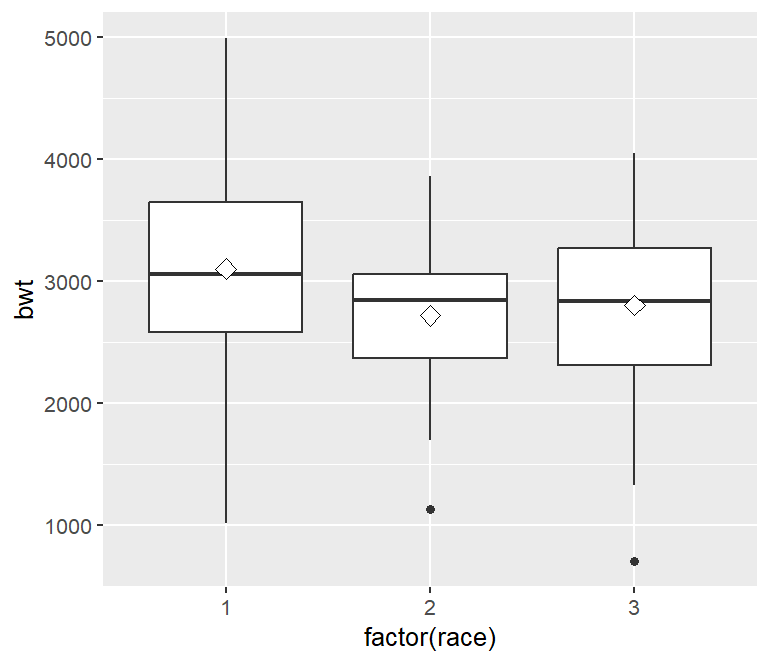
可以像箱线图中添加菱形表示平均值
1
2
3
4
5
6
|
p <- ggplot(birthwt, aes(x = factor(race), y = bwt))+
geom_boxplot()+
stat_summary(fun = mean, geom = "point", shape = 23, size = 3, fill = "white")
# fun = mean 表示计算每组 y 的均值
# geom = "point" 表示是用点来把几何对象画出来
p
|
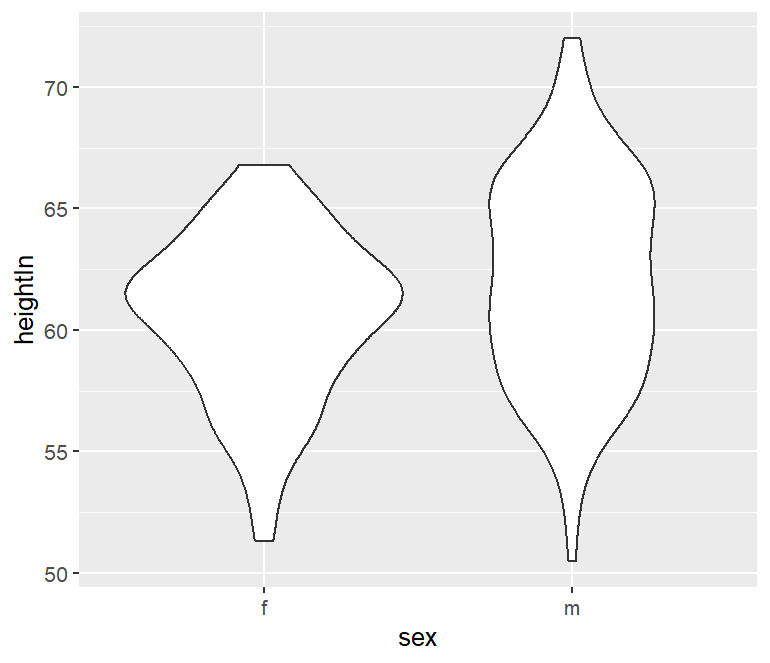
小提琴图
小提琴图可以观察到样本的分布情况,小提琴的宽度代表该数值位置样本数量的多少,越宽样本数量越多。小提琴图通过 geom_violin() 函数绘制。
1
2
3
4
|
library(gcookbook)
p <- ggplot(heightweight, aes(x = sex, y = heightIn))+
geom_violin()
p
|
1
2
3
4
5
6
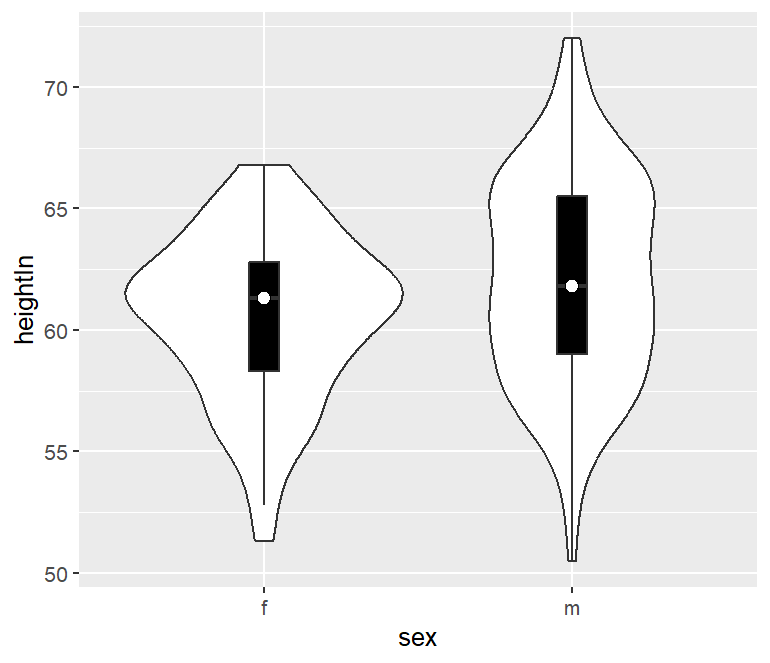
|
p <- ggplot(heightweight, aes(x = sex, y = heightIn))+
geom_violin()+
geom_boxplot(width = 0.1, fill = "black", outlier.color = NA)+
stat_summary(fun = median, geom = "point", fill = "white", shape = 21, size = 2.5)
# outlier.color = NA 不绘制离群点
p
|
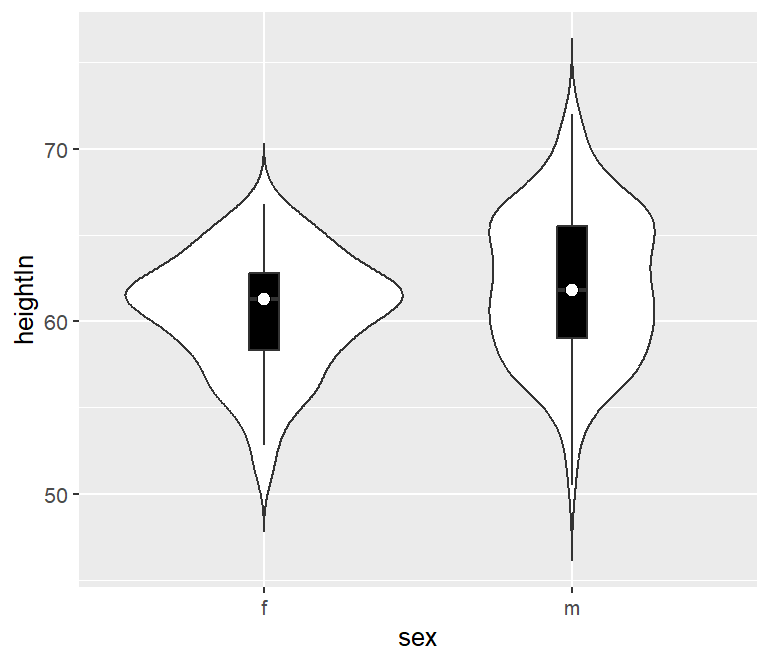
默认的小提琴图范围是从最小到最大数据值,可以通过设置 trim = FALSE 保留尾巴
1
2
3
4
5
|
p <- ggplot(heightweight, aes(x = sex, y = heightIn))+
geom_violin(trim = FALSE)+
geom_boxplot(width = 0.1, fill = "black", outlier.color = NA)+
stat_summary(fun = median, geom = "point", fill = "white", shape = 21, size = 2.5)
p
|
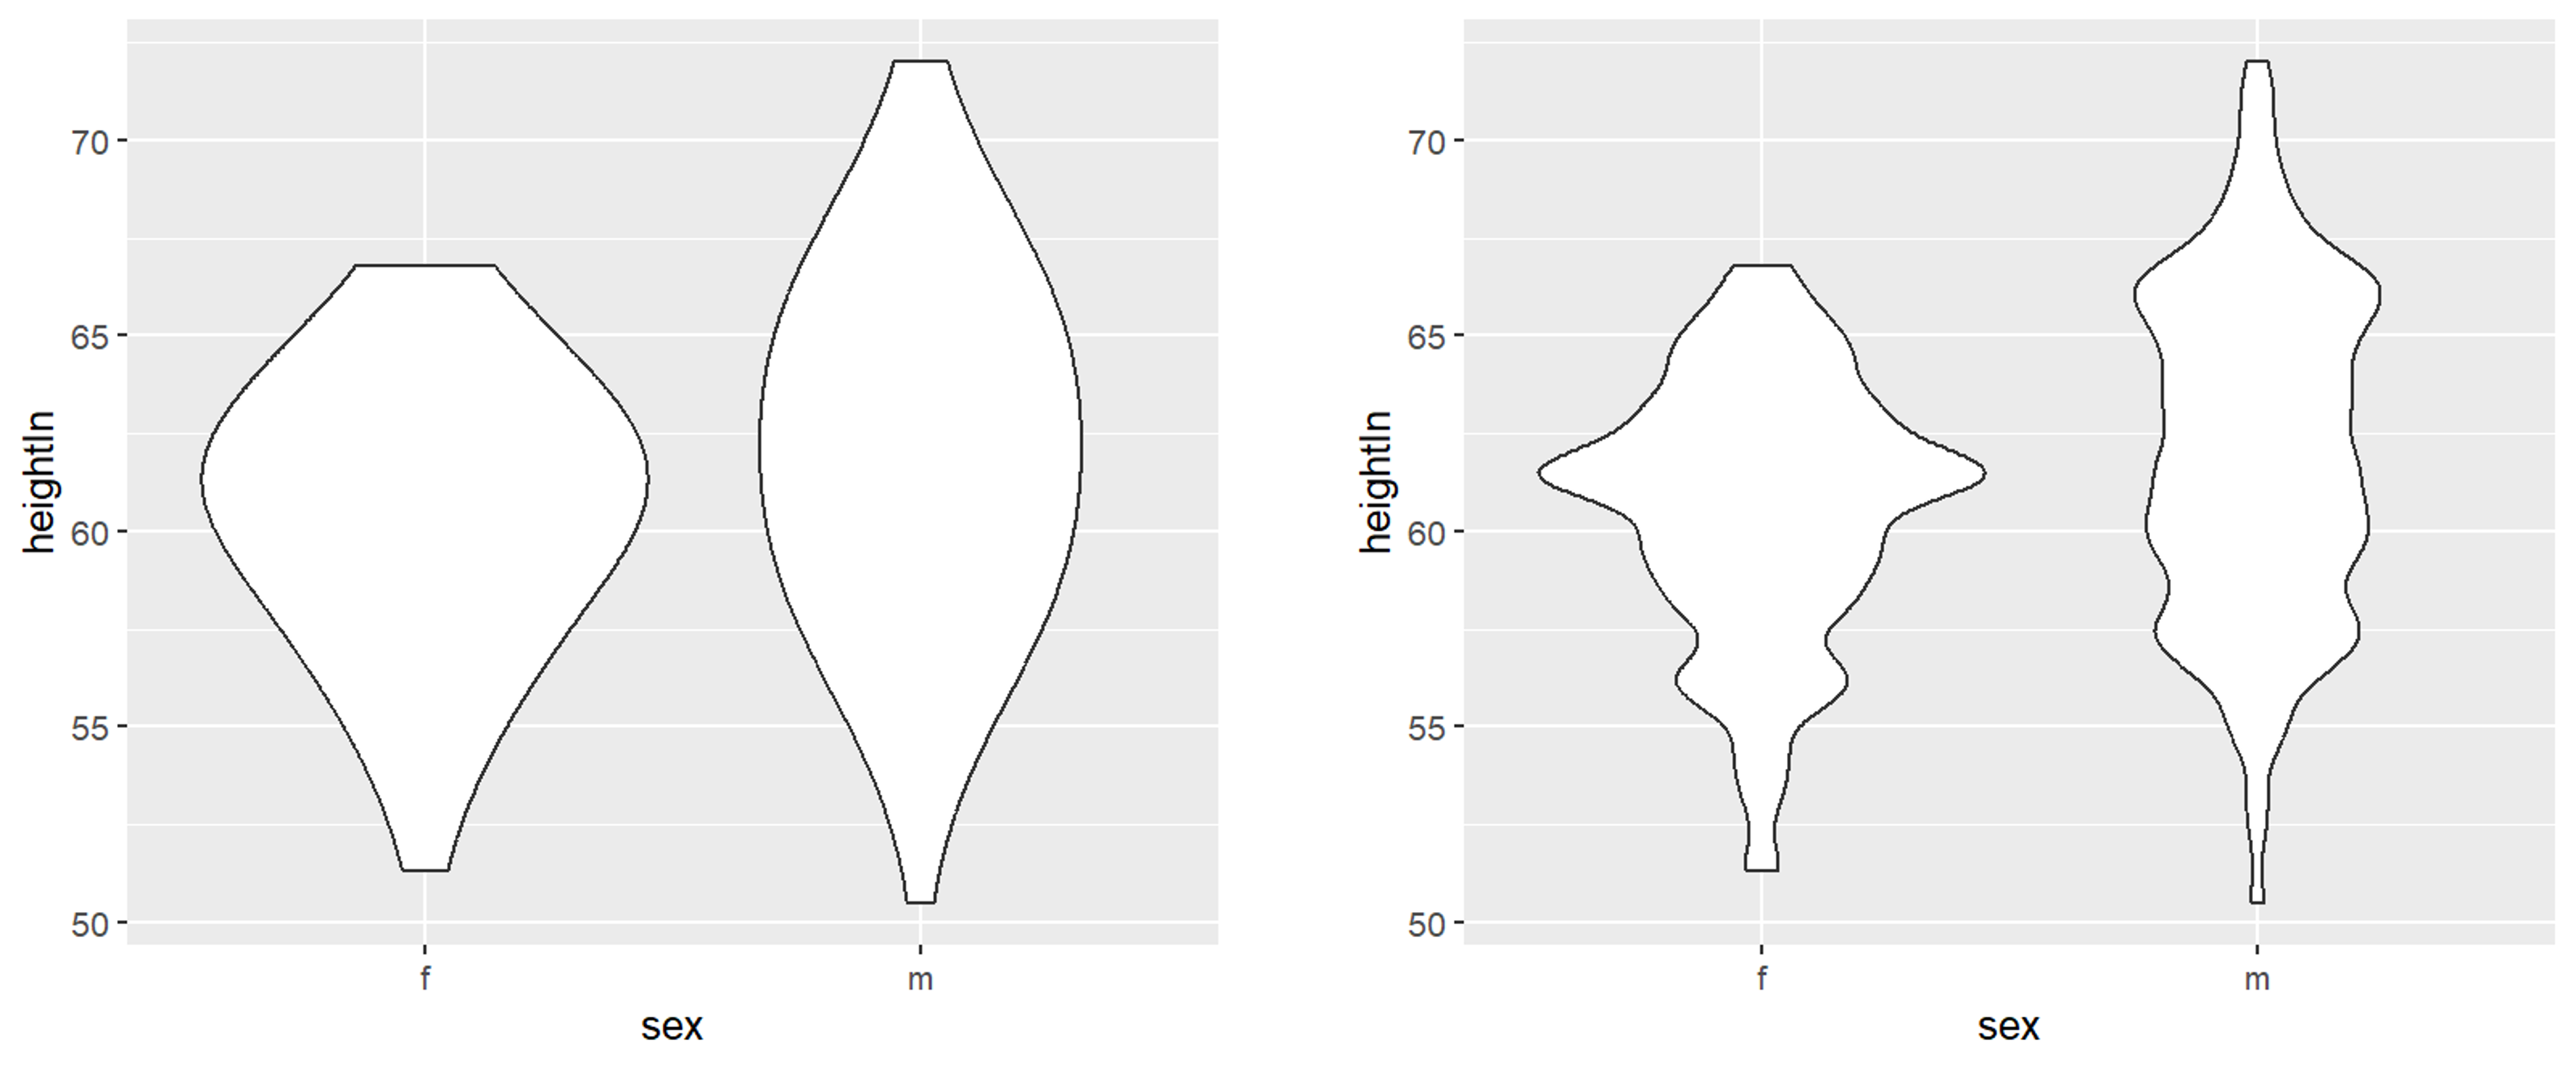
可以改变 adjust 参数来调整小提琴线轮廓的平滑程度
1
2
3
4
5
6
7
8
9
|
# 左图
p <- ggplot(heightweight, aes(x = sex, y = heightIn))+
geom_violin(adjust = 2)
p

# 右图
p <- ggplot(heightweight, aes(x = sex, y = heightIn))+
geom_violin(adjust = 0.5)
p
|
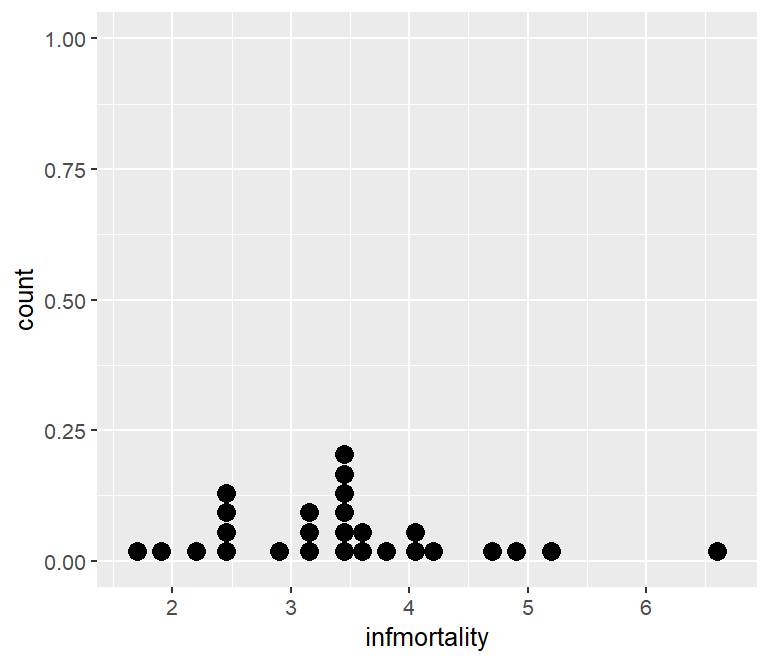
点阵图
又叫威尔金森点图(Wilkinson Dot Plot),是一种展示连续变量分布的点阵可视化,每个点代表 1 个观测样本,点堆叠的高度代表该区域样本频数,而非实际的 y 轴数值。选取 geom_dotplot() 进行绘图。
有点类似于 geom_histogram, 两者都是把数据分箱看频数的分布,只不过直方图是柱状表示,而点阵图是点状表示。
 1
 2
 3
 4
 5
 6
 7
 8
 9
10
|
# 数据预处理
library(gcookbook)
library(tidyverse)
c2009 <- countries %>%
filter(Year == 2009 & healthexp > 2000)

# 绘图
p <- ggplot(c2009, aes(x = infmortality))+
geom_dotplot()
p
|
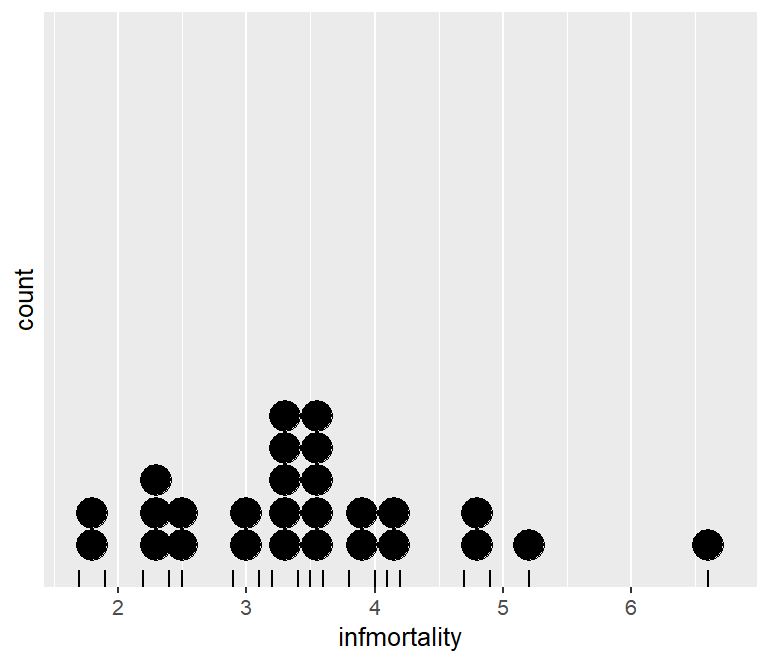
通过 binwidth 更改横轴每个箱的最大宽度,并美化点阵图
1
2
3
4
5
6
|
p <- ggplot(c2009, aes(x = infmortality))+
geom_dotplot(binwidth = .25)+
geom_rug()+
scale_y_continuous(breaks = NULL) # 删除 y 轴上全部数字刻度
theme(axis.title.y = element_blank()) # 删除 y 轴标签
p
|
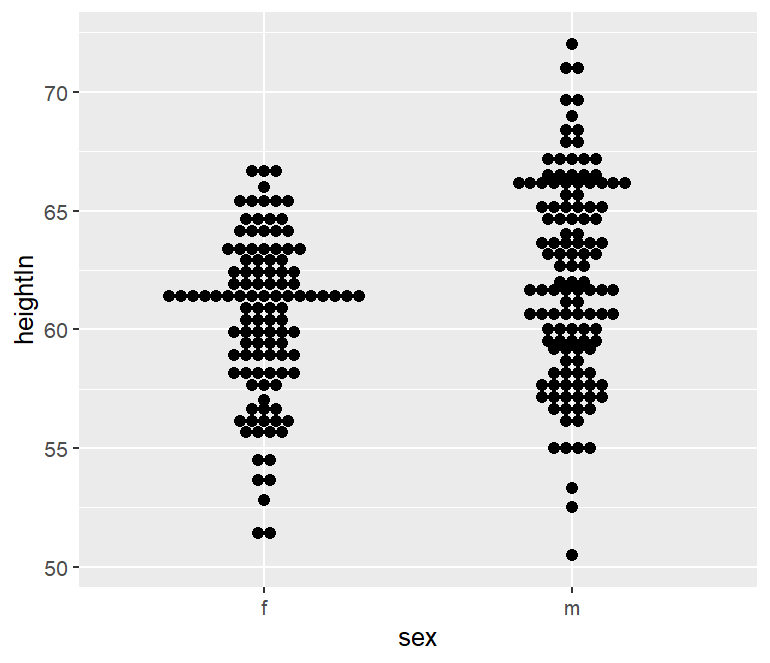
为了比较多个群,可以设置将点沿着 y 轴堆叠,并沿着 x 轴分组;可见下图其分布轮廓很像我们所作的小提琴图。
1
2
3
|
p <- ggplot(heightweight, aes(x = sex, y = heightIn))+
geom_dotplot(binaxis = "y", binwidth = .5, stackdir = "center")
p
|
1
2
3
4
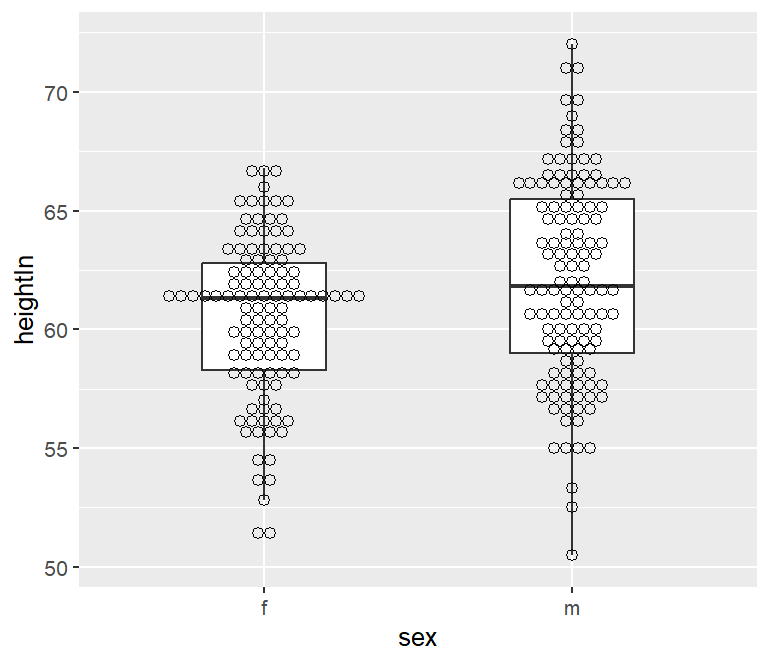
|
p <- ggplot(heightweight, aes(x = sex, y = heightIn))+
geom_boxplot(outlier.color = NA, width = .4)+
geom_dotplot(binaxis = "y", binwidth = .5, stackdir = "center", fill = NA)
p
|
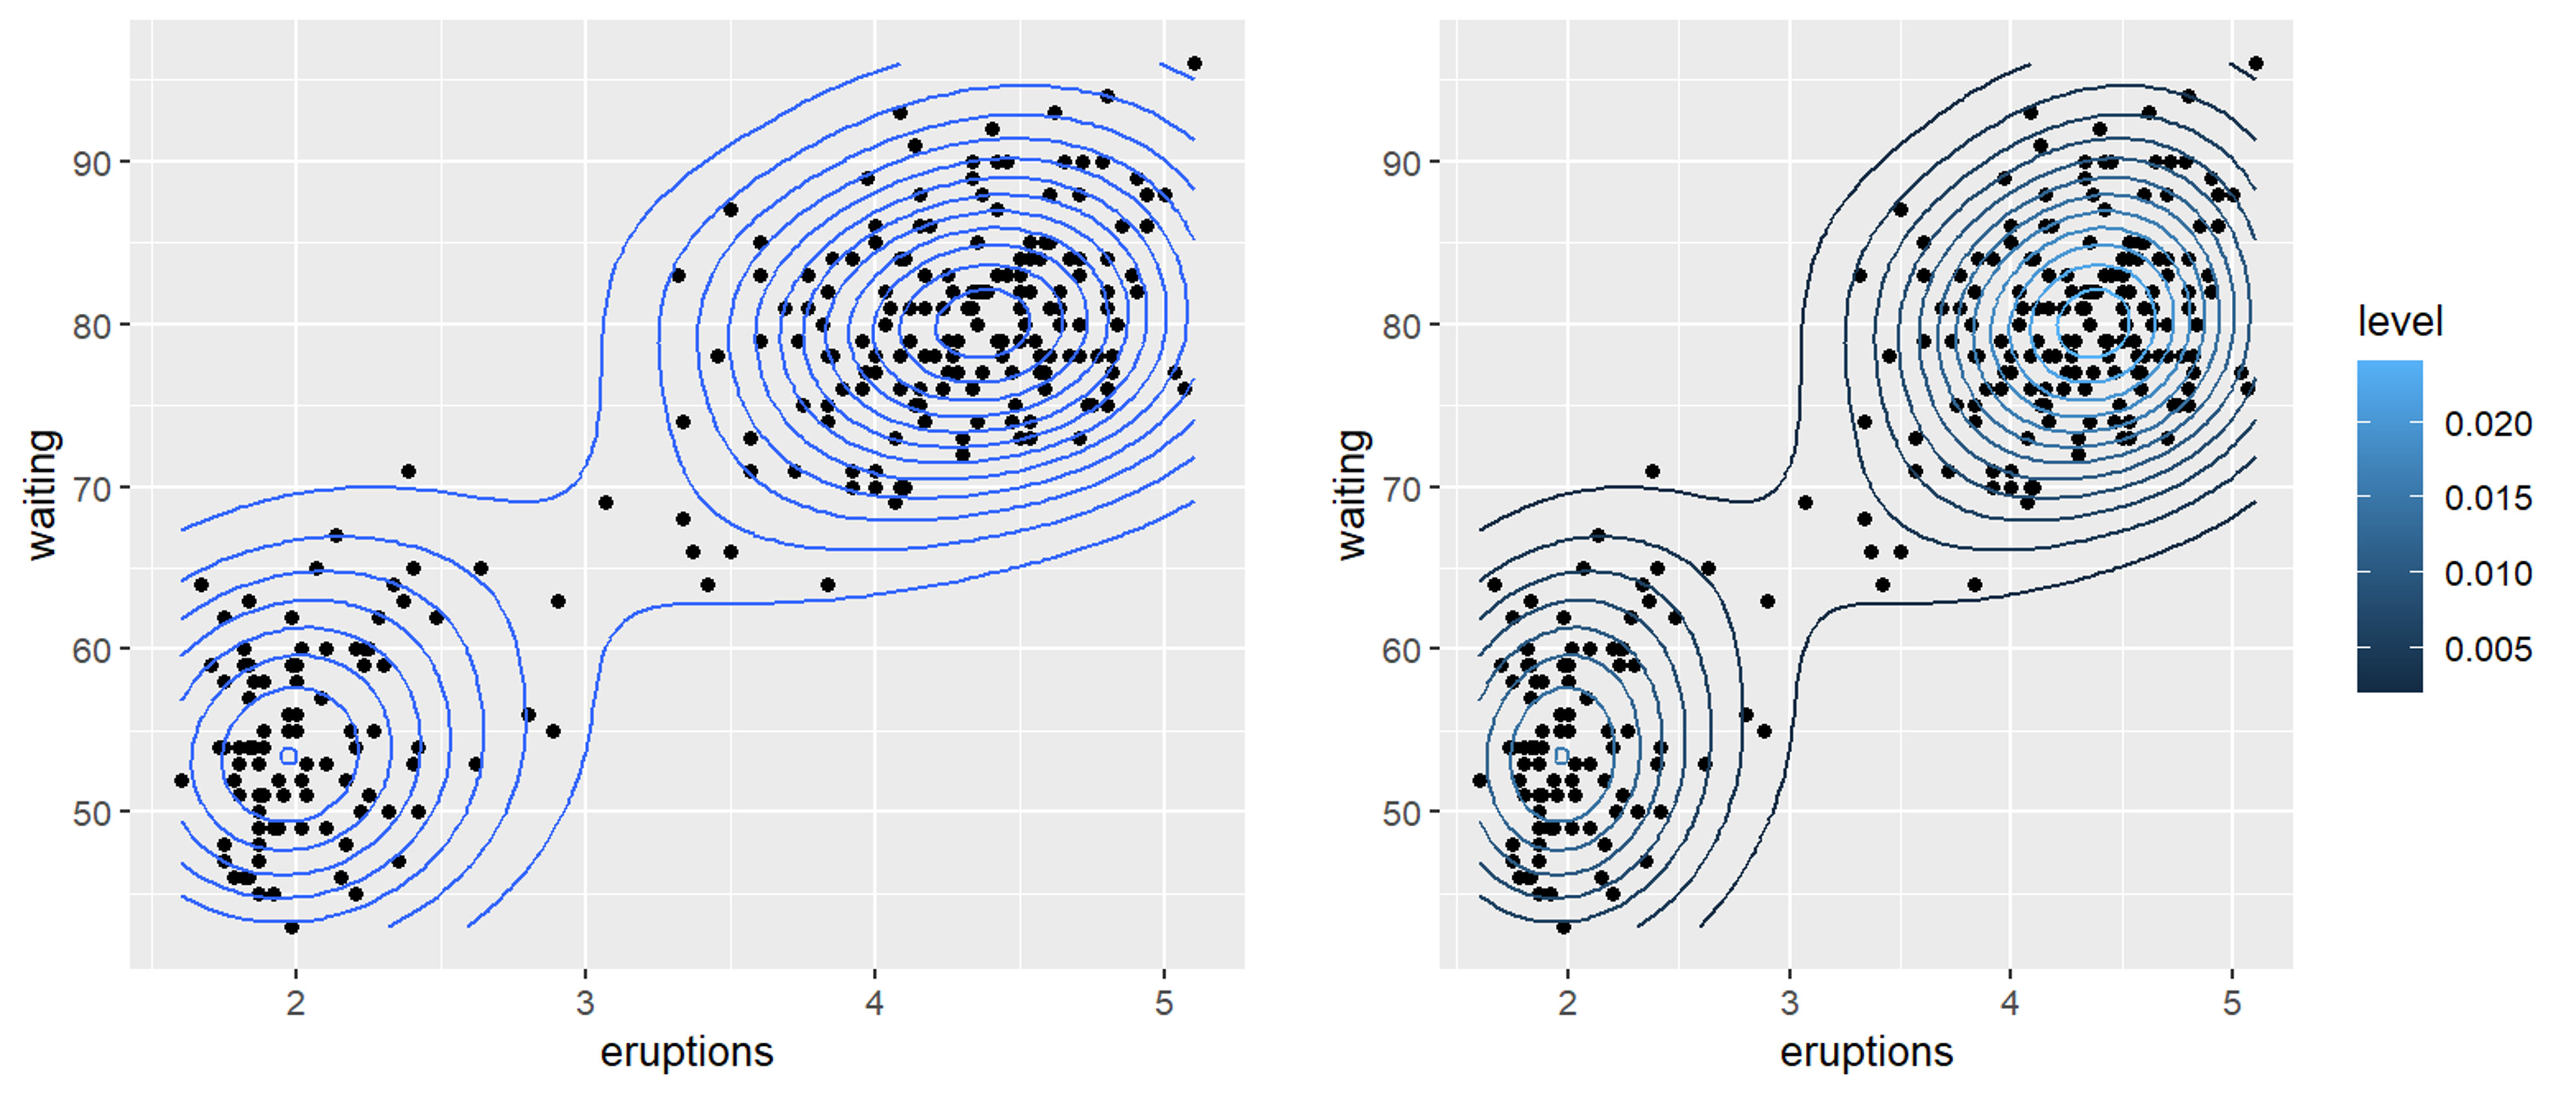
二维密度图
二维密度图可以同时处理 x、y 两个连续数值变量,估计二维平面上点的聚集程度,是二维版本核密度估计(KDE);其解决了大量散点图重叠时样本密集的问题
 1
 2
 3
 4
 5
 6
 7
 8
 9
10
|
p <- ggplot(faithful, aes(x = eruptions, y = waiting))+
geom_point()+
stat_density2d()
p

p <- ggplot(faithful, aes(x = eruptions, y = waiting))+
geom_point()+
stat_density2d(aes(color = after_stat(level)))
# level 是绘制等高线后内部的派生变量,代表等高线的密度层级
p
|
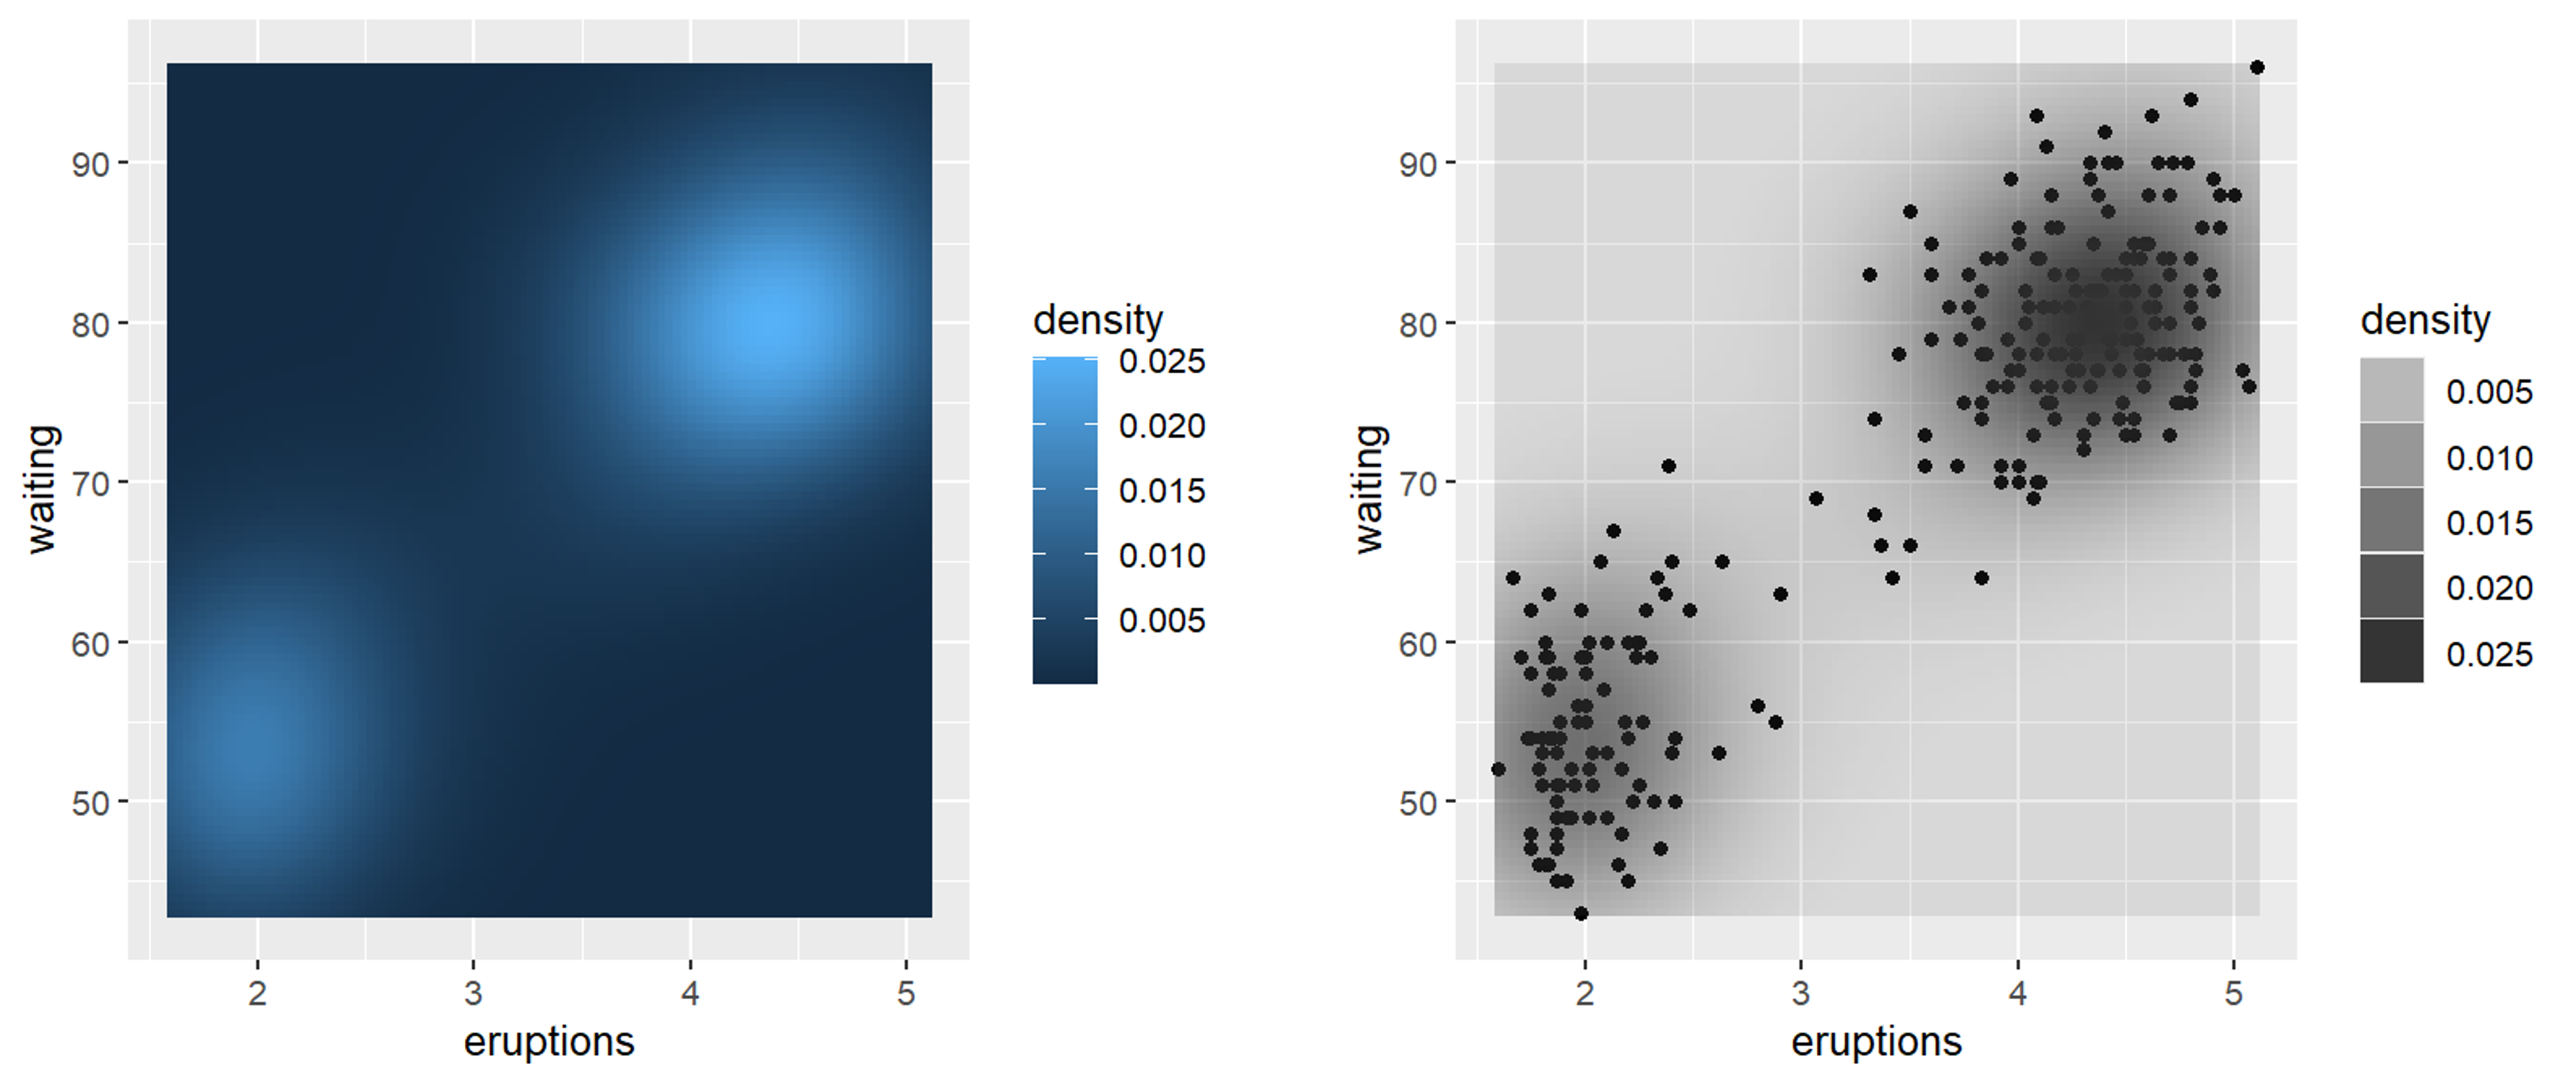
在 geom_density_2d() 中默认有 contour=TRUE 等高线层级,当关闭等高线层级后可以用原始二维核密度值来填充颜色表示密度
 1
 2
 3
 4
 5
 6
 7
 8
 9
10
11
12
|
p <- ggplot(faithful, aes(x = eruptions, y = waiting))+
stat_density2d(aes(fill = after_stat(density)), geom = "raster", contour = FALSE)
# 密度映射到 fill 填充颜色
# geom = "raster" 表示用 raster 光栅几何对象渲染密度网格
p

p <- ggplot(faithful, aes(x = eruptions, y = waiting))+
geom_point()+
stat_density2d(aes(alpha = after_stat(density)), geom = "tile", contour = FALSE)
# 密度映射到 alpha 透明度,底层叠原始点
# geom = "tile" 表示一个个矩形瓦片组成热力网格
p
|
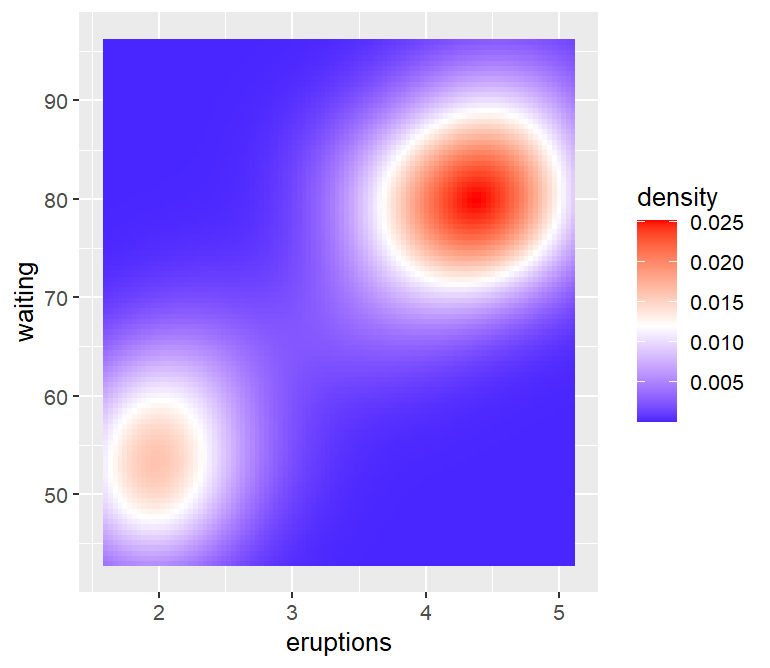
尝试把上面的默认颜色更改一下,好像也丑丑的……😫
1
2
3
4
|
p <- ggplot(faithful, aes(x = eruptions, y = waiting))+
stat_density2d(aes(fill = after_stat(density)), geom = "raster", contour = FALSE)+
scale_fill_gradient2(low = "blue", mid = "white", high = "red", midpoint = 0.012)
p
|
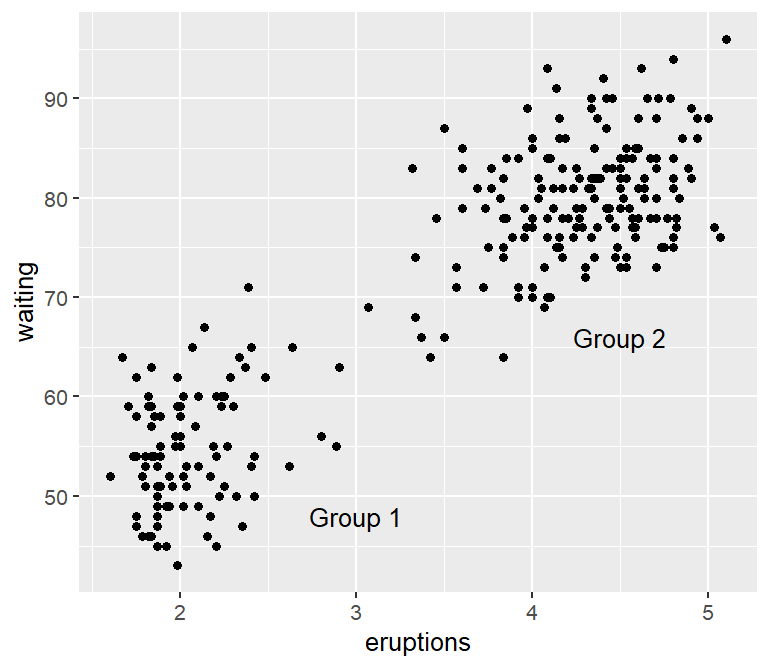
注释
通常情况下仅仅显示数据还不够,添加一些注释信息可让图片更直观、易解读。
1
2
3
|
annotate(geom, x, y, ...)
# geom指定注释类型:"text"、"segment"、"rect"、"point"、"arrow"
# x、y代表注释的坐标位置
|
文本注释
1
2
3
4
5
|
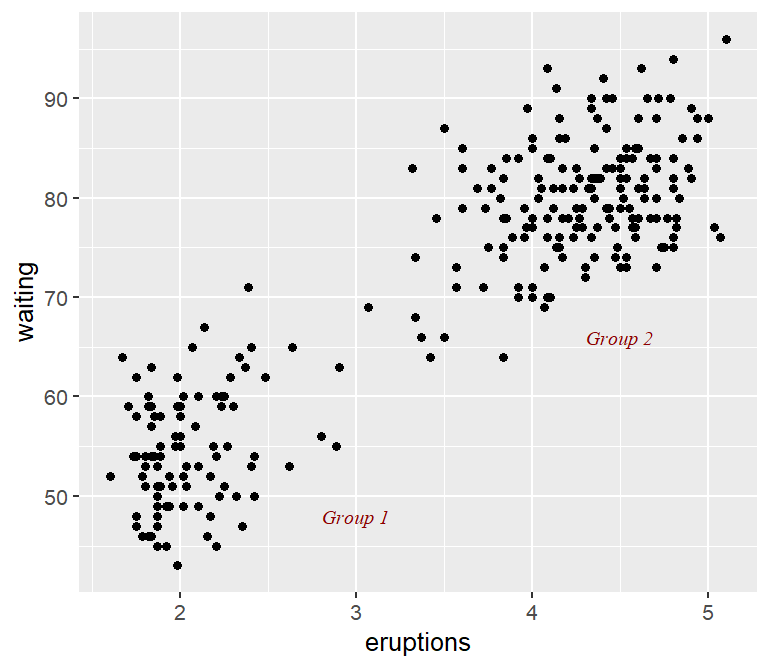
p <- ggplot(faithful, aes(x = eruptions, y = waiting)) +
geom_point()+
annotate("text", x = 3, y = 48, label = "Group 1")+
annotate("text", x = 4.5, y = 66, label = "Group 2")
p
|
family 代表字体族,serif 是衬线字体(宋体类);sans 为无衬线字体(黑体)
fonface 代表字体样式,italic 为斜体,plain 为普通,bold 为粗体,bold.italic 为粗斜体
1
2
3
4
5
|
p <- ggplot(faithful, aes(x = eruptions, y = waiting)) +
geom_point()+
annotate("text", x = 3, y = 48, label = "Group 1", family = "serif", fontface = "italic", color = "darkred", size = 3)+
annotate("text", x = 4.5, y = 66, label = "Group 2", family = "serif", fontface = "italic", color = "darkred", size = 3)
p
|
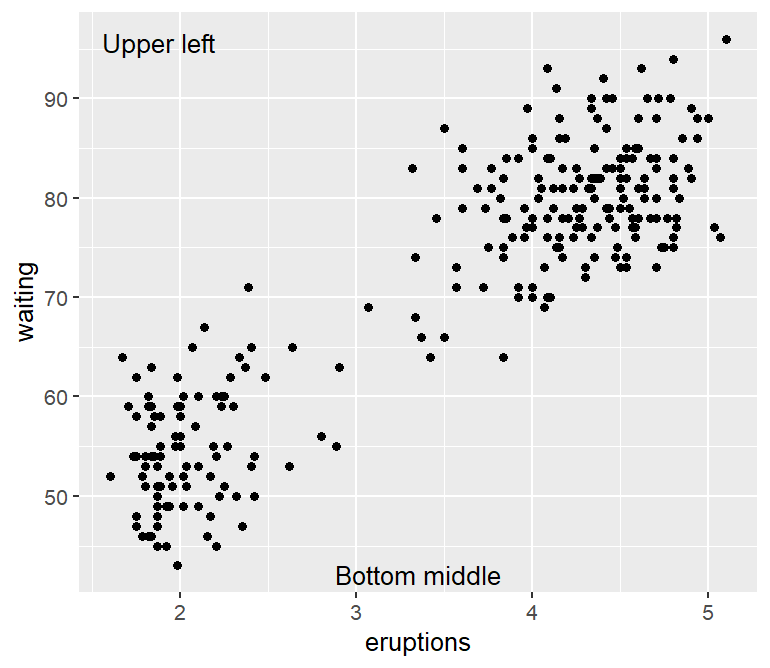
当位置参数 x 和 y 等于 Inf 时表示无穷大坐标,即可通过组合表示图片的四个角的位置
hjust |
参考点为给定的 x 坐标,用于调整水平位置 |
vjust |
参考点为给定的 y 坐标,用于调整垂直位置 |
1
2
3
4
5
|
p <- ggplot(faithful, aes(x = eruptions, y = waiting))+
geom_point()+
annotate("text", x = -Inf, y = Inf, label = "Upper left", hjust = -.2, vjust = 2)+
annotate("text", x = mean(range(faithful$eruptions)), y = -Inf, vjust = -0.4, label = "Bottom middle")
p
|
数学注释
 1
 2
 3
 4
 5
 6
 7
 8
 9
10
11
12
13
14
|
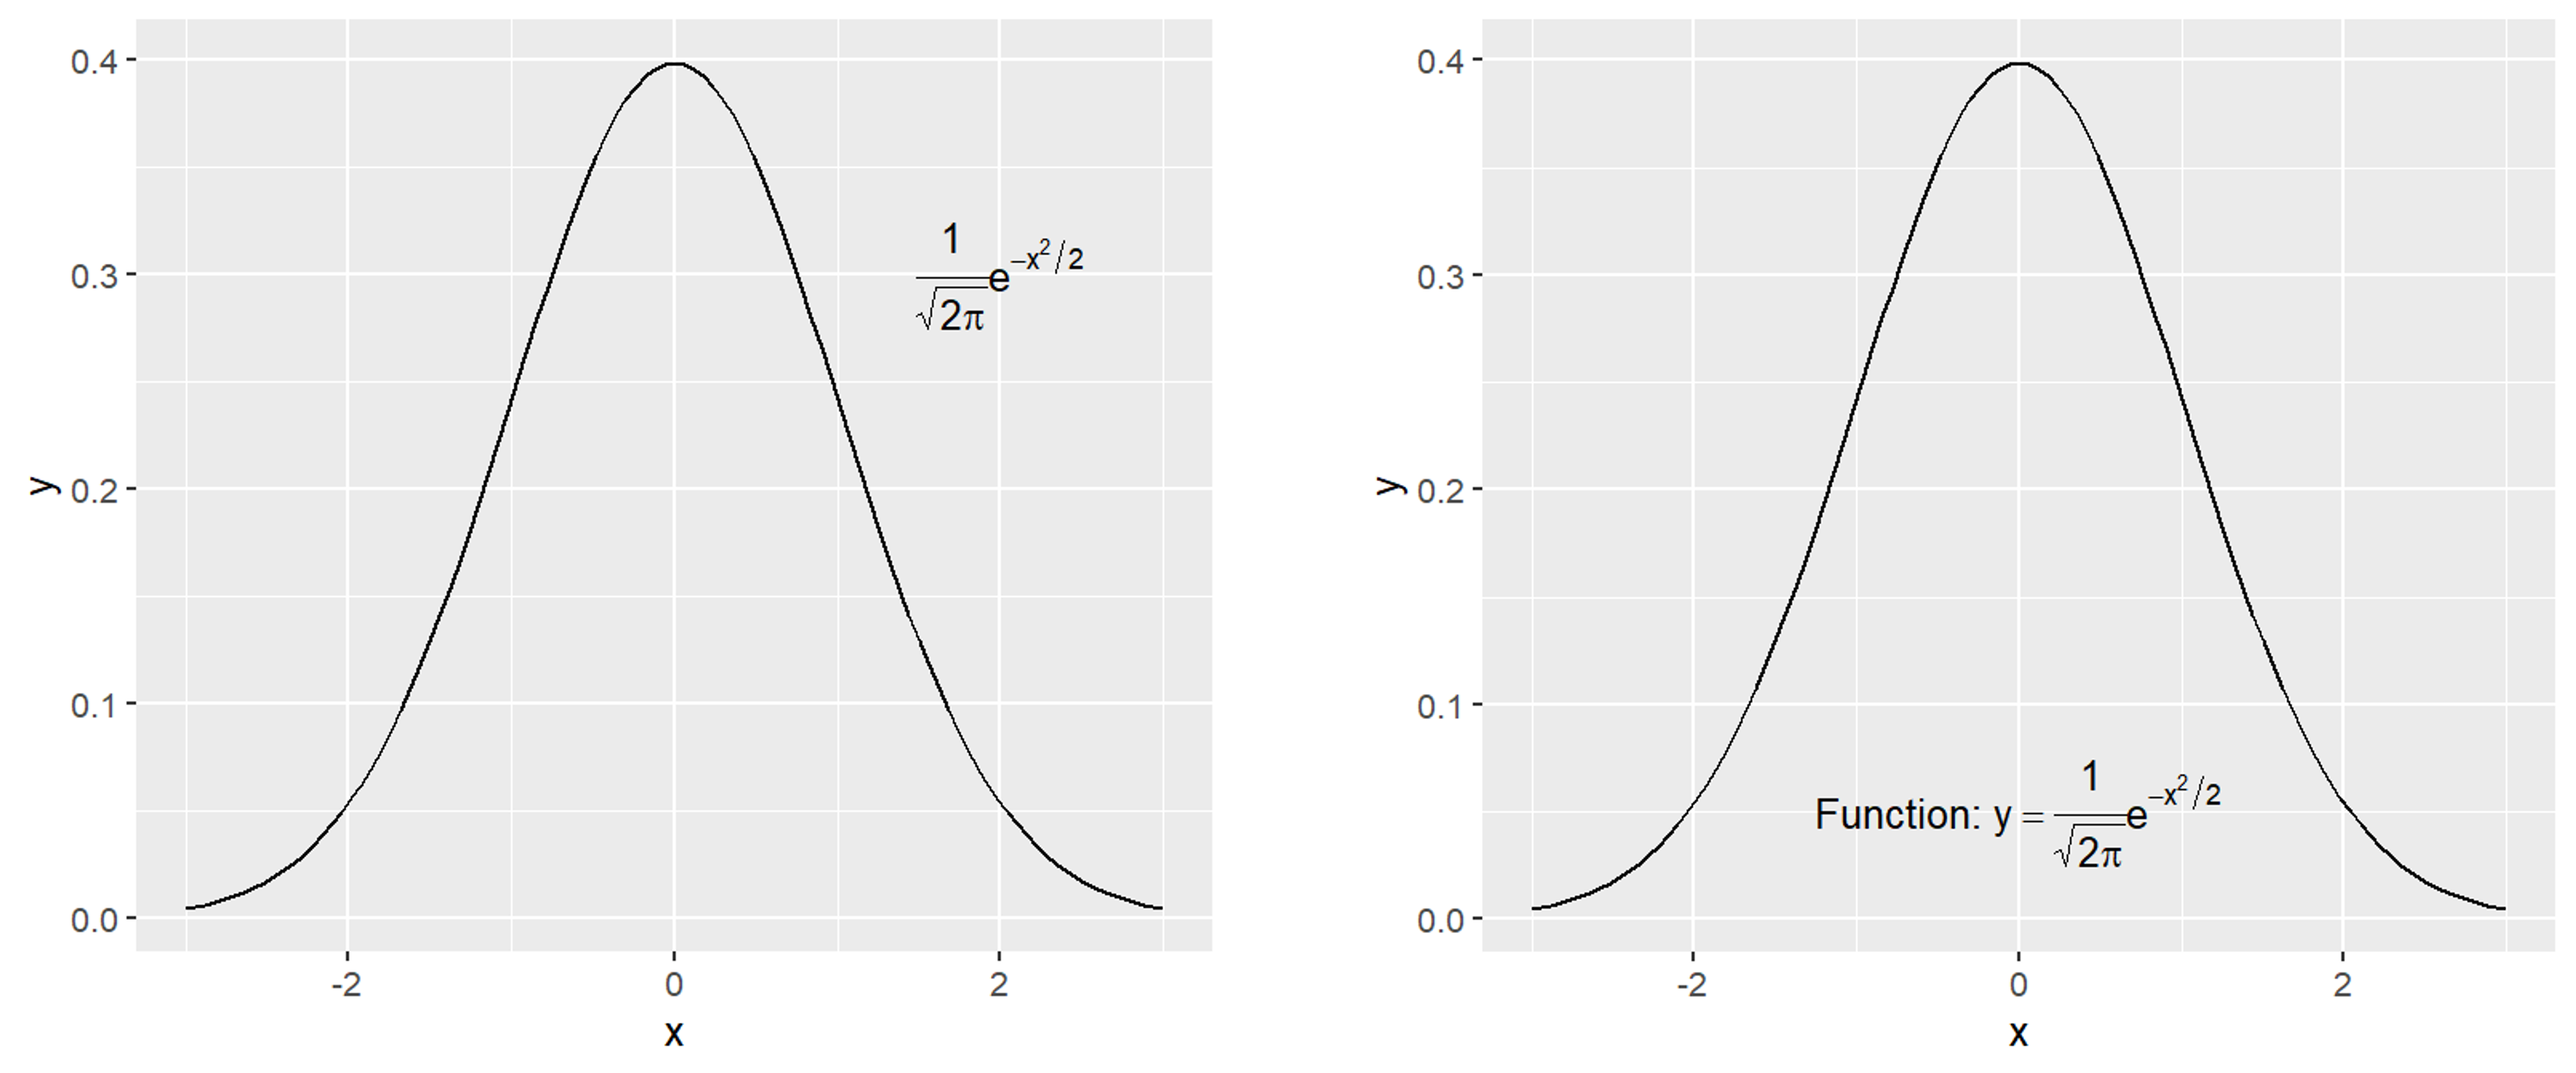
p <- ggplot(data.frame(x = c(-3, 3)), aes(x = x))+
stat_function(fun = dnorm)+
# stat_function() 属于 stat 统计层,会根据 dnorm 生成正态分布的 y
annotate("text", x = 2, y = .3, parse = TRUE,
        label = "frac(1, sqrt(2 * pi)) * e ^ {-x^2 / 2}")
# parse = TRUE 使用的是 R 自带的 plotmath 数学语法
p

# 数学式子与文本内容混合需要使用''*标记明文部分
p <- ggplot(data.frame(x = c(-3, 3)), aes(x = x))+
stat_function(fun = dnorm)+
annotate("text", x = 0, y = .05, parse = TRUE,
        label = "'Function: '* y==frac(1, sqrt(2 * pi)) * e ^ {-x^2 / 2}")
p
|
线条
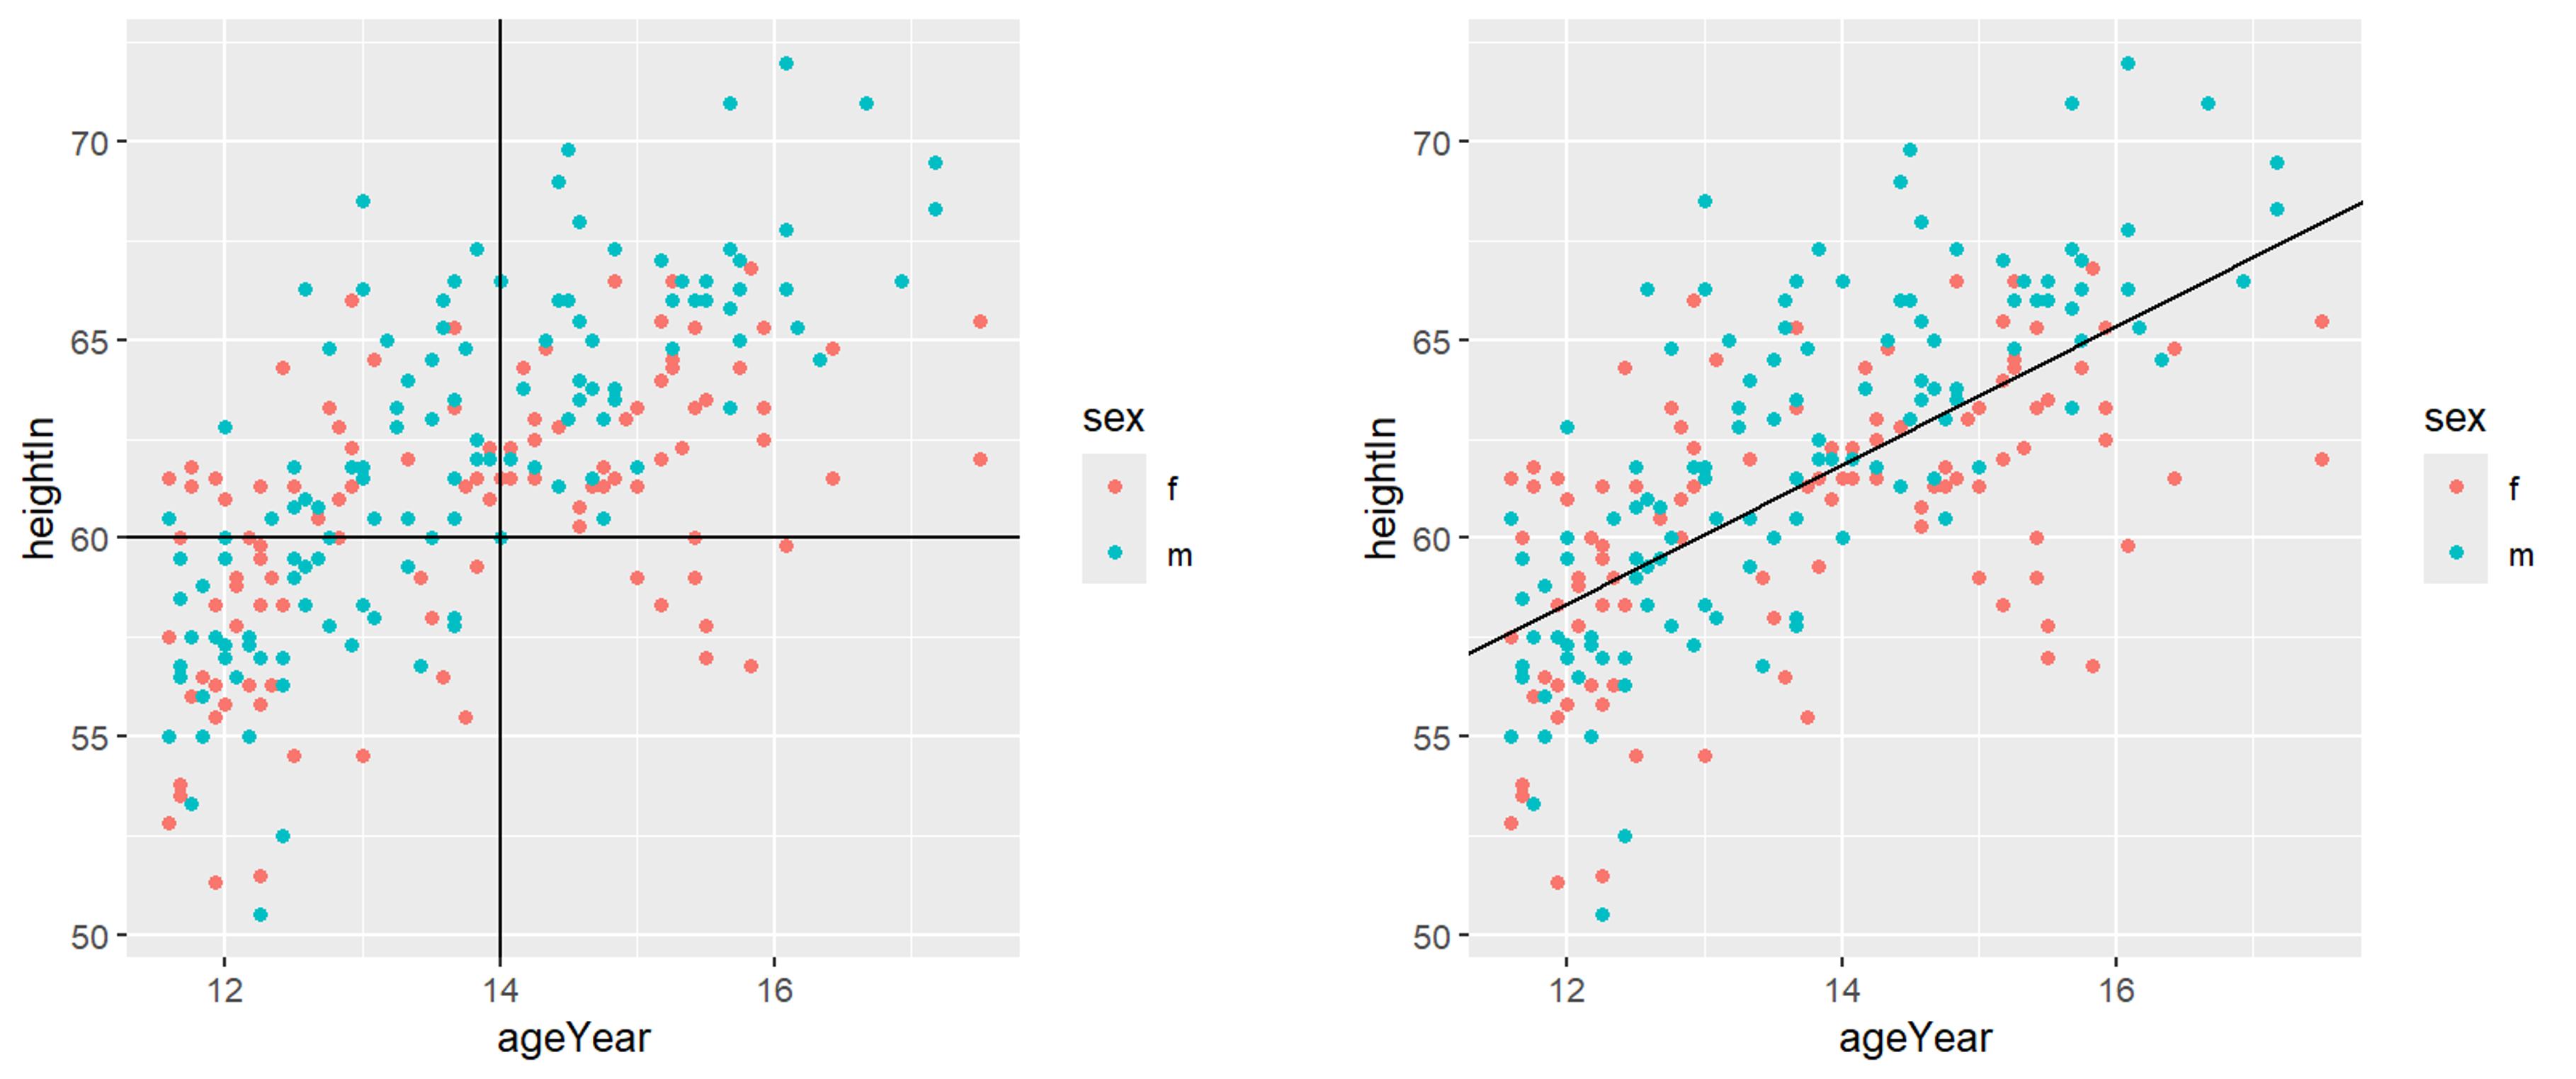
绘制线条主要可以使用 geom_hline()、geom_vline() 和 geom_abline() 来完成
geom_hline() |
水平线 |
geom_vline() |
垂直线 |
geom_abline() |
一般直线 |
 1
 2
 3
 4
 5
 6
 7
 8
 9
10
11
12
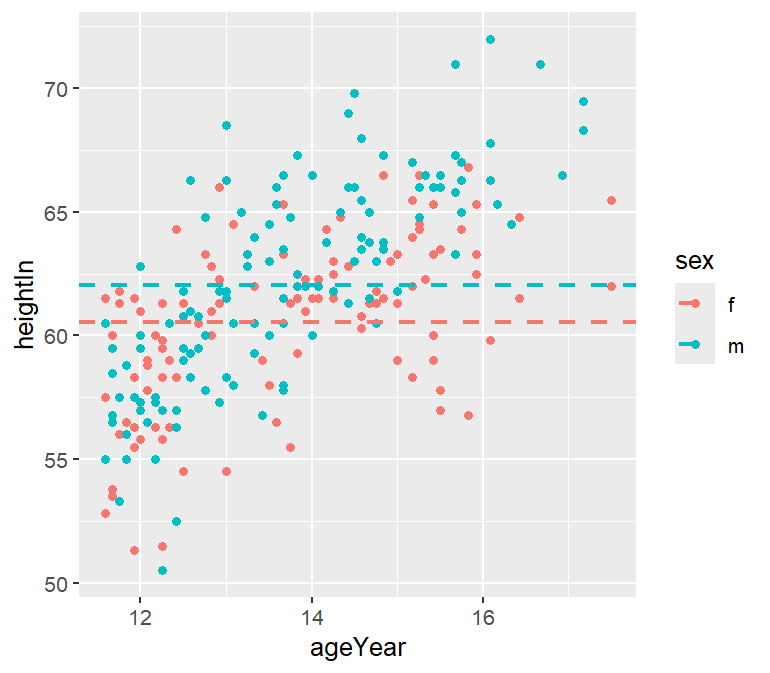
|
library(gcookbook)
p <- ggplot(heightweight, aes(x = ageYear, y = heightIn, color = sex))+
geom_point()+
geom_hline(yintercept = 60)+
geom_vline(xintercept = 14)
p

p <- ggplot(heightweight, aes(x = ageYear, y = heightIn, color = sex))+
geom_point()+
geom_abline(intercept = 37.4, slope = 1.75)
# intercept 和 slope 分别控制截距和斜率
p
|
虚线绘制则增添 linetype 选取 "dashed"
 1
 2
 3
 4
 5
 6
 7
 8
 9
10
|
# 数据预处理
hw_means <- heightweight %>%
group_by(sex) %>%
summarise(heightIn = mean(heightIn))

# 绘制性别分类下平均体重虚线
p <- ggplot(heightweight, aes(x = ageYear, y = heightIn, color = sex))+
geom_point()+
geom_hline(data = hw_means, aes(yintercept = heightIn, colour = sex), linetype = "dashed", size = 1)
p
|
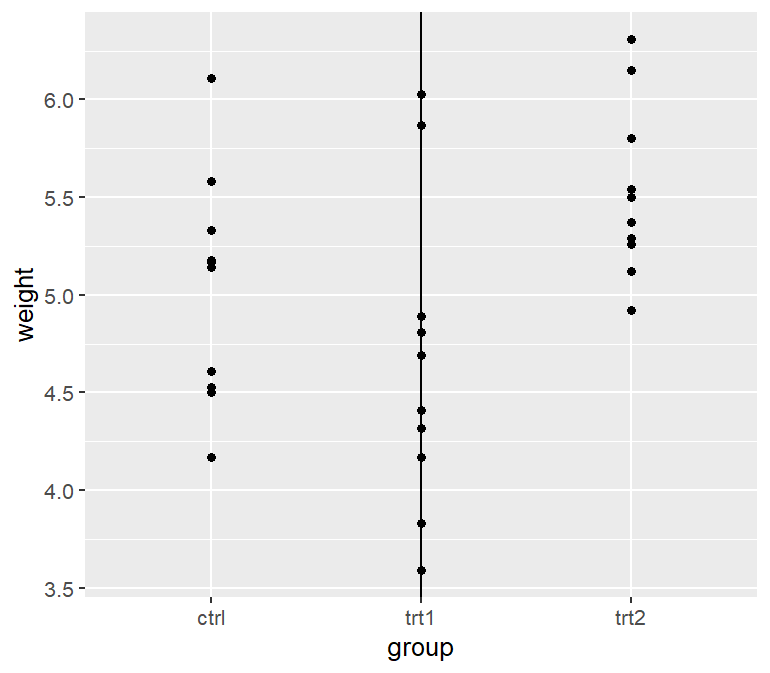
当存在某条轴的是离散的而非连续的,可用因子表示,第一层数值为 1,第二层值为 2,依此类推。
1
2
3
4
5
6
|
p <- ggplot(PlantGrowth, aes(x = group, y = weight))+
geom_point()+
geom_vline(xintercept = 2) # 第二个因子
p

# 等价于 geom_vline(xintercept = which(levels(PlantGrowth$group) == "trt1"))
|
线段与箭头
1
2
3
4
5
6
7
8
9
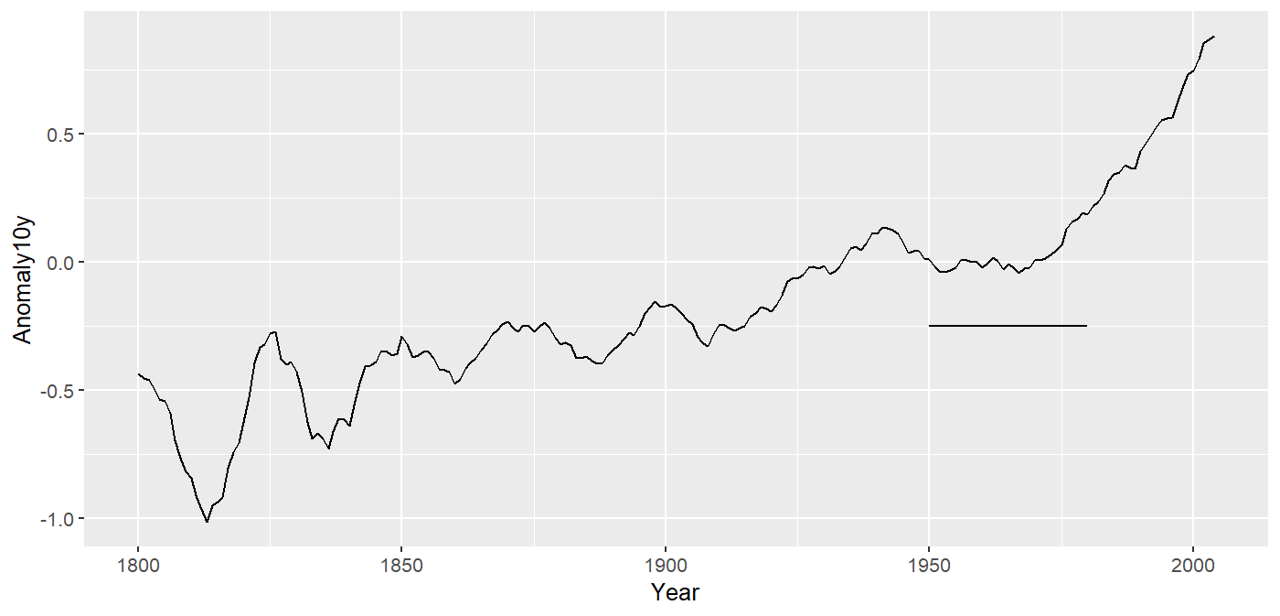
|
# 数据预处理
library(gcookbook)
cm <- climate %>%
filter(Source == "Berkeley")

p <- ggplot(cm, aes(x = Year, y = Anomaly10y))+
geom_line()+
annotate("segment", x = 1950, xend = 1980, y = -.25, yend = -.25)
p
|
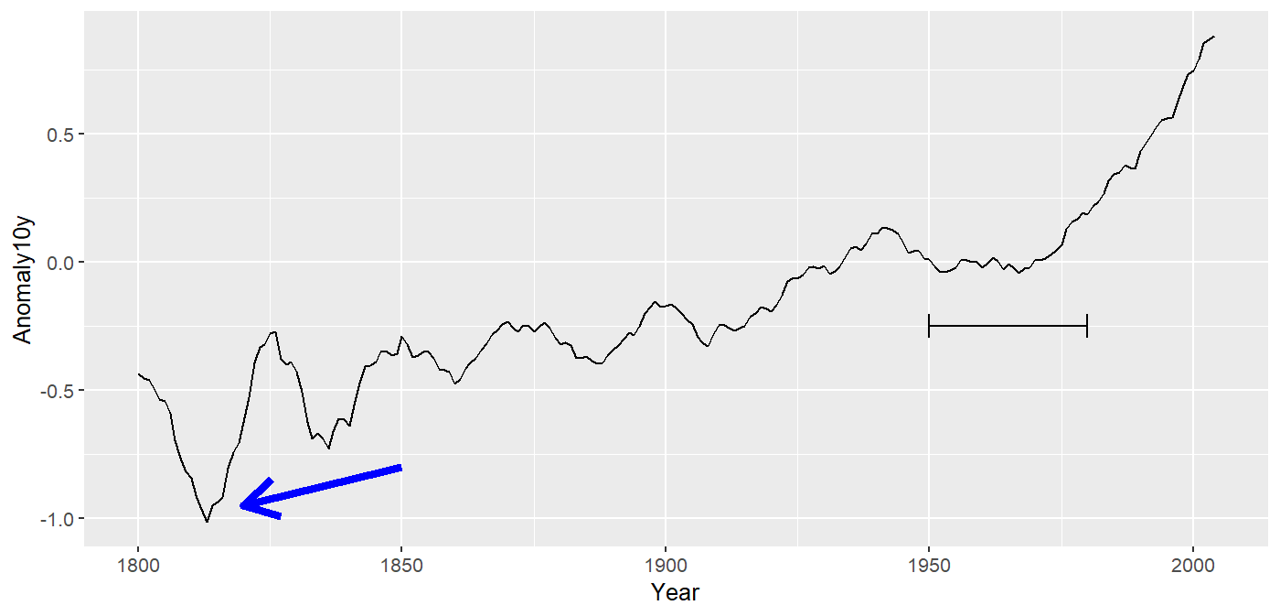
可以用网格给线段添加箭头或平端
1
2
3
4
5
6
|
p <- ggplot(cm, aes(x = Year, y = Anomaly10y))+
geom_line()+
annotate("segment", x = 1950, xend = 1980, y = -.25, yend = -.25, arrow = arrow(ends = "both", angle = 90, length = unit(.2, "cm")))+
annotate("segment", x = 1850, xend = 1820, y = -.8, yend = -.95, color = "blue", size = 2, arrow = arrow())
# 默认 arrow 角度为30,默认长度为 0.25 英寸
p
|
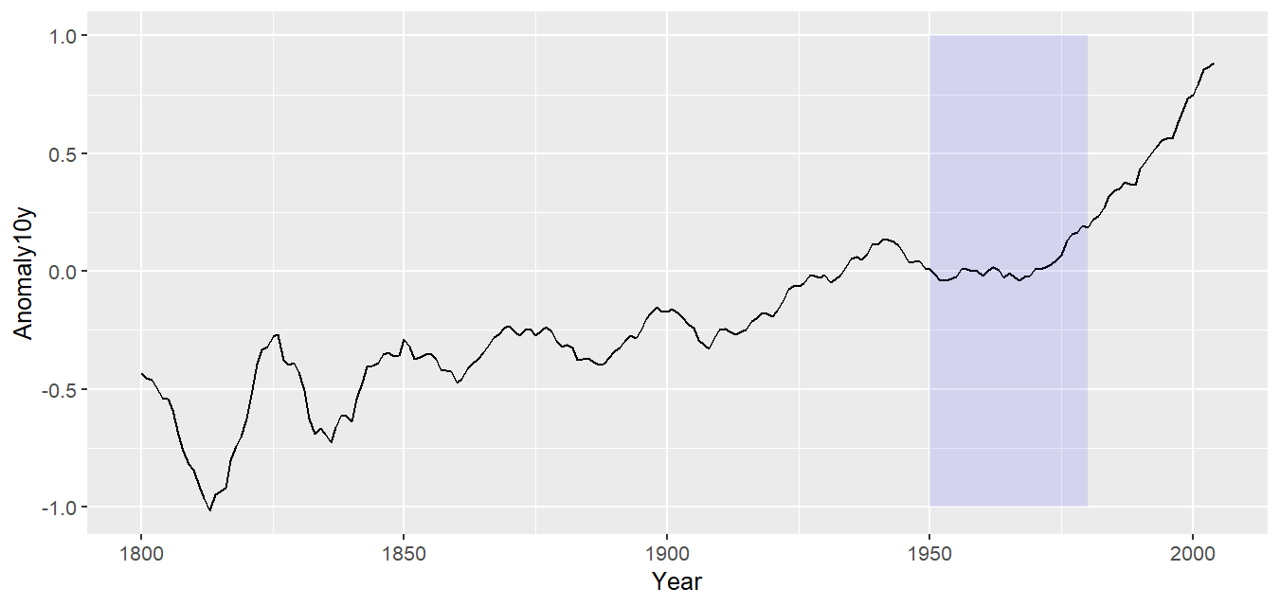
阴影
1
2
3
4
5
6
|
library(gcookbook)
p <- ggplot(filter(climate, Source == "Berkeley"), aes(x = Year, y = Anomaly10y))+
geom_line()+
annotate("rect", xmin = 1950, xmax = 1980, ymin = -1, ymax = 1, alpha = 0.1, fill = 'blue')
# 选择矩形注释
p
|
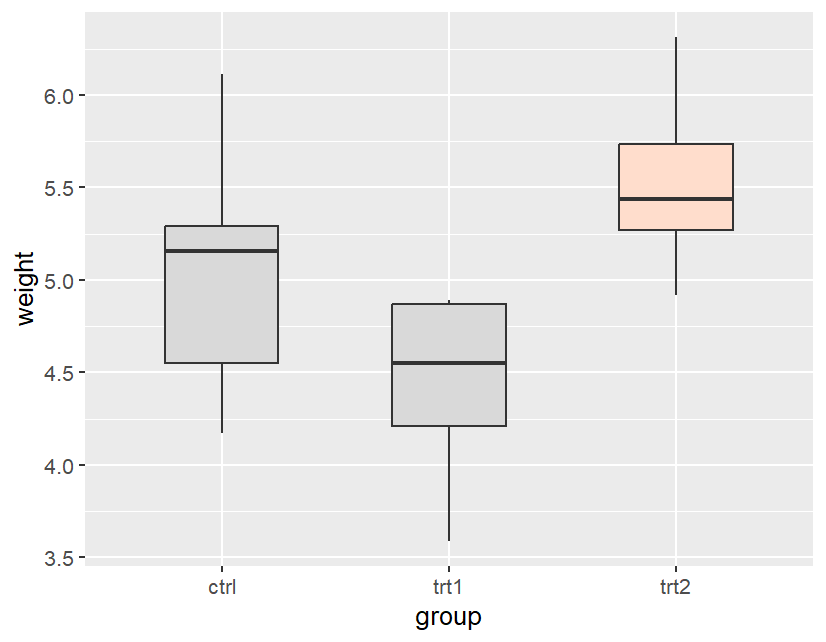
高亮
1
2
3
4
5
6
7
8
9
|
# 数据预处理
pg <- PlantGrowth %>%
mutate(hl = recode(group, "ctrl" = "no", "trt1" = "no", "trt2" = "yes"))
# 给数据框新增列

p <- ggplot(pg, aes(x = group, y = weight, fill =hl))+
geom_boxplot(width = .5, outliers = FALSE)+
scale_fill_manual(values = c("grey85", "#FFDDCC"), guide = FALSE)
p
|
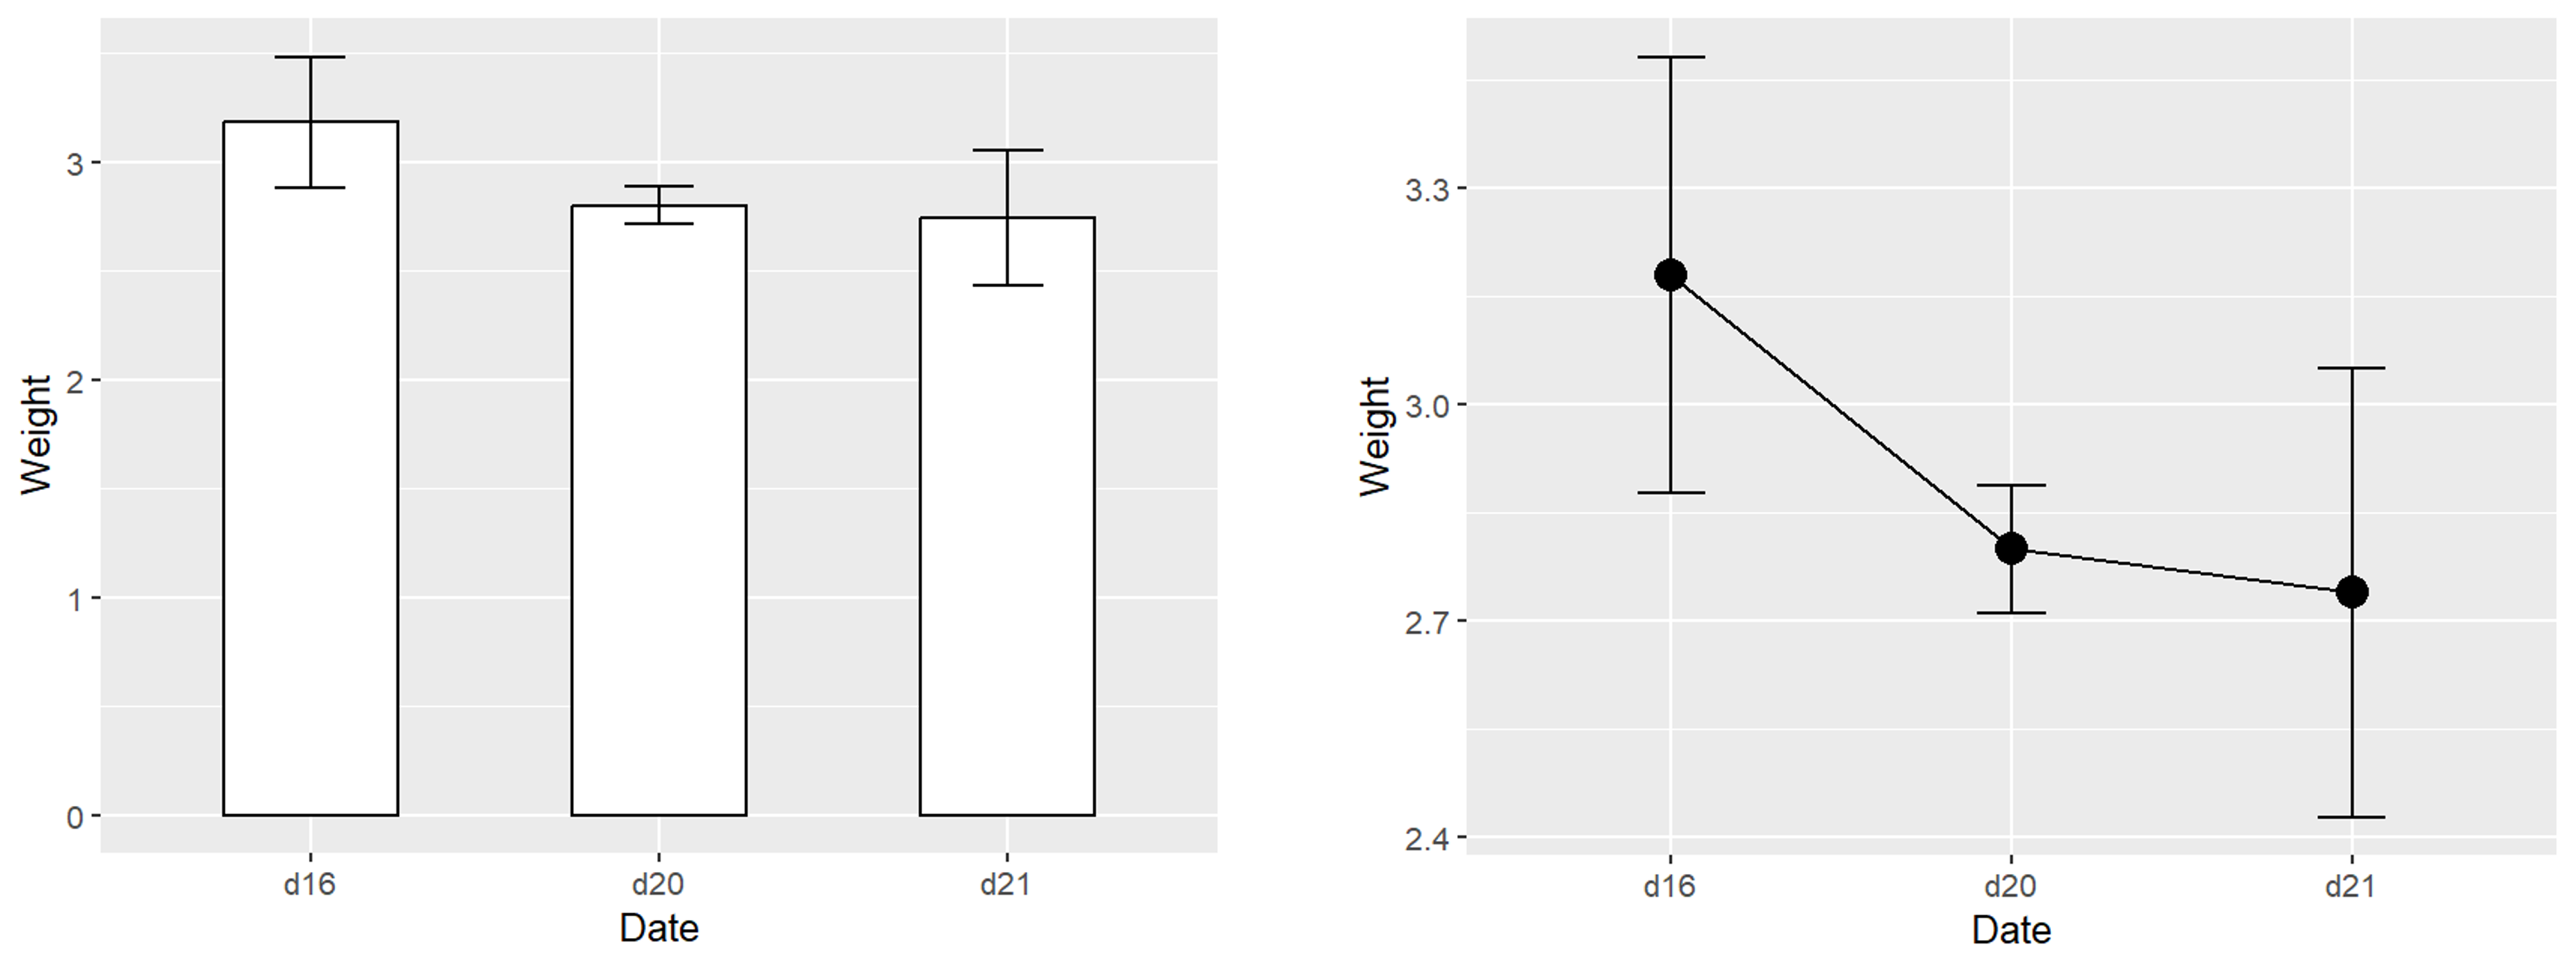
误差条
 1
 2
 3
 4
 5
 6
 7
 8
 9
10
11
12
13
14
15
16
17
18
|
# 数据预处理
library(gcookbook)
library(tidyverse)
ce <- cabbage_exp %>%
filter(Cultivar == "c39")

# geom_col() 柱状图
p <- ggplot(ce, aes(x = Date, y = Weight))+
geom_col(fill = "white", color = "black", width = .5)+
geom_errorbar(aes(ymin = Weight - se, ymax = Weight + se), width = .2)
p

# geom_line() 折线图
p <- ggplot(ce, aes(x = Date, y = Weight))+
geom_point(size = 4)+
geom_line(aes(group = 1))+
geom_errorbar(aes(ymin = Weight - se, ymax = Weight + se), width = .2)
p
|